50 Shades of Value: Part I


The premise of value investing is simple—less-expensive companies tend to outperform more-expensive companies in the long term. Its first proponents can be traced back to the 1930s, beginning with the iconic value investor Benjamin Graham. Value was first referred to in terms of “factors” in Eugene Fama and Kenneth French’s renowned 1993 academic paper.1 In their paper, value was defined using a company’s current book value. Since then, practitioners in the industry have adapted and created their own definitions of value in their attempts to beat the market. Below, we contrast different measures of value to help explain drivers of returns across U.S. equities.
Common ways used to identify value include price-to-book (P/B), price-to-earnings (P/E), dividend yield and EV/EBITDA metrics. The definition of value used in an investment strategy matters because it drives material differences in a value portfolio’s sector and fundamental characteristics. The definition also matters because it can affect how sensitive a strategy is to interest rates, which empirical research has proven is a significant driver for the value factor. At WisdomTree, we implicitly tilt our Indexes toward value by fundamentally weighting constituents using their dividends or earnings in an approach we pioneered more than 11 years ago.
Performance of Value Over the Past Decade
Russell 1000 Index

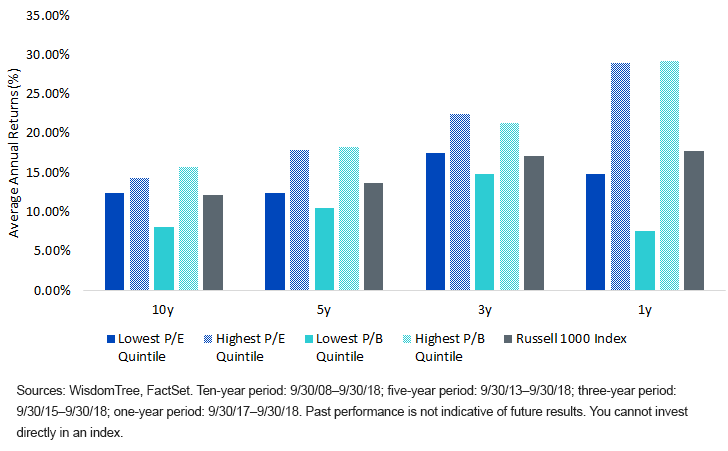
In the chart above, we show the annualized return for the broad-based Russell 1000 Index over several time periods in the gray bars, along with the performance of its constituents in its lowest and highest P/E or P/B quintiles. There is a generalized sense in the investment community that value as a factor has lagged the market over the last 10 years. So, it is no surprise that the most expensive stocks ( highest P/E or P/B quintiles, which are shown in the textured bars) have outperformed the cheapest companies (those that are in the lowest P/E or P/B quintiles). What is worth pointing out is how the return of the lowest P/E quintile in dark blue has kept up or outperformed the Russell 1000 in every period, while the lowest P/B quintile in teal has significantly trailed. In our view, the devil is in the details when it comes to defining value.
WisdomTree’s Original Value Approach
In 2007, WisdomTree launched its U.S. earnings-weighted Index family. Once a year, the U.S. earnings-weighted Indexes are reconstituted by weighting companies with positive earnings by their proportionate share of total aggregate earnings. Companies with greater earnings generally have larger weights in the Index. This methodology results in our U.S. earnings family having a significant weight in the lowest P/E quintile, or cheaply valued stocks, in the investment universe.
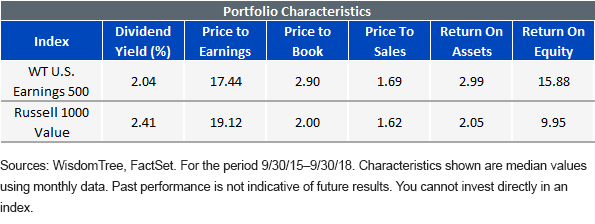
Below, we compare the portfolio characteristics of the implicitly tilted WisdomTree U.S. Earnings 500 Index (WTEPS) with the explicitly tilted Russell 1000 Value Index. The Russell 1000 Value Index is built by over-weighting companies that have a lower P/B ratio within their respective universe. This results in the index being significantly over-weight in the Financials and Energy sectors, which tend to have a lower P/B, and under-weight in the Information Technology sector, which has a higher P/B. At the portfolio level, the result of over-weighting these companies rather than weighting by earnings can be seen in a higher P/E ratio along with lower profitability metrics.

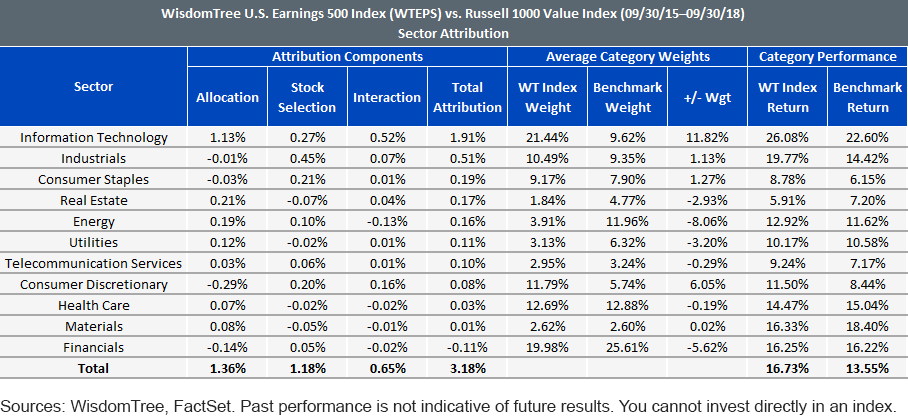
As would be expected, sector tilts stemming from different methodologies have a significant impact on performance. Over the last three years, WTEPS has outperformed the Russell 1000 Value Index by 3.18% annually. Most of the outperformance comes from WTEPS being over-weight in the high P/B sectors such as Information Technology, Industrials and Consumer Staples, while being under-weight in Financials did not create a significant drag in performance.

Conclusion
Modern-day value investors have two main arguments why this investment style works: behavioral biases and risk premium. Most investors romantically focus on stocks with a narrative about the future as opposed to those that are undervalued and have experienced a fall in their price, which makes cheap stocks cheaper than they should be. Value stocks should also compensate investors for higher levels of risk given their attractive valuations. There are many shades of value, and investors should be aware of the consequences of using different definitions.
1Eugene F. Fama and Kenneth R. French, “Common Risk Factors in the Returns on Stocks and Bonds,” Journal of Financial Economics, volume 33, issue 1, February 1993, pages 3–56.

Alejandro Saltiel joined WisdomTree in May 2017 as part of the Quantitative Research team. Alejandro oversees the firm’s Equity indexes and actively managed ETFs. He is also involved in the design and analysis of new and existing strategies. Alejandro leads the quantitative analysis efforts across equities and alternatives and contributes to the firm’s website tools and model portfolio infrastructure. Prior to joining WisdomTree, Alejandro worked at HSBC Asset Management’s Mexico City office as Portfolio Manager for multi-asset mutual funds. Alejandro received his Master’s in Financial Engineering degree from Columbia University in 2017 and a Bachelor’s in Engineering degree from the Instituto Tecnológico Autónomo de México (ITAM) in 2010. He is a holder of the Chartered Financial Analyst designation.

