
U.S. Fixed Income: Looking at U.S. High Yield, by Default


Has the fixed income arena entered a new phase? While the lion’s share of attention has been given to interest rate developments for quite some time now, another topic for discussion has been where we are in terms of the U.S. credit cycle. Specifically, the debate has centered on whether the corporate bond market has entered the bottom of the ninth inning of the current cycle or whether the time frame is more akin to being in the sixth or seventh inning. Interestingly, in sticking with this baseball analogy, there does seem to be agreement that credit is not in the first few innings.
For this blog post, the focus will be on U.S. high yield (HY), particularly because if one was to see the first signs of stress, the argument could be made that this is the sector where investors should turn their attention. Over the last six months, investors have witnessed two episodes where HY spreads have visibly widened. The first of these episodes occurred during late October to mid-November of last year, when spreads rose 53 basis points (bps).1 The second occurrence was more recent, as HY differentials moved from more than a decade low of 311 bps on January 26 up to 369 bps two weeks later, representing a widening of 58 bps.2
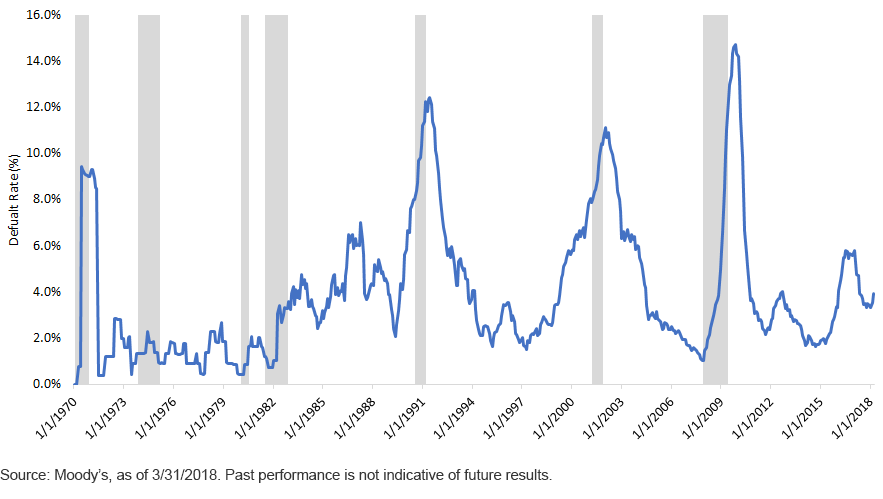
U.S. Speculative-Grade Issuer Default Rate vs. Recessions
It is interesting to note that in both cases the widening trends were rather brief (two to three weeks) and of similar magnitudes. In addition, both times the sell-off was short-lived, as buyers re-emerged and compressed spreads back down.
A more headline-grabbing metric is the default rate. According to Moody’s, since Q4 2010, the U.S. speculative-grade issuer default rate has been relatively contained. The only notable exception occurred in the mid-2016 to early 2017 period, a by-product of the energy-induced sell-off that transpired when crude oil prices plummeted to between $26 and $28 per barrel. As a result, the default rate rose to 5.81% in January 2017, and subsequently dropped to 3.43%3 by December of that year.
Another interesting aspect to the high-yield default rate is whether it can help foretell a potential recession. As the graph illustrates, the results have been somewhat mixed on that front and really didn’t provide much guidance from 1970 into the early 1980s. However, in the case of the 1990–1991 and 2001 economic downturns, an ascending trend did serve as a precursor for the subsequent recessions. In both instances, the HY default rate not only rose ahead of the downturn but also continued to increase and remain elevated even after the recession was officially deemed to have ended, before resuming a downward trajectory. In fact, default rates reaching double-digit territory was also the norm. For the record, there was no predictive value for the financial crisis and/or the great recession.
Conclusion
As of March of this year, that measure has crept back up to 3.92%, which is still measurably below the 20-year average rate of 4.65%. For the record, the overall peak reading is 14.74%, which was registered as a result of the financial crisis in November 2009. Looking ahead, Moody’s forecasts the HY default rate will drift back down as 2018 progresses, finishing the year at 2.39%.4 After taking into consideration spread activity and the forward-looking approach to the HY default rate, we would tend to fall into the camp that considers the credit cycle to be in the sixth or seventh inning.
1Source: Bloomberg, as of 4/17/08.
2Source: Bloomberg, as of 4/17/18.
3Source: Moody’s, as of 4/17/18.
4Source: Moody’s, as of 4/17/18.
Share & Comment
Popular Posts
Categories
Related Links