DGRW
U.S. Quality Dividend Growth Fund

Published June 12, 2026

Global Head of Research
Every WisdomTree performance report lists two return figures for each ETF:
The reason those two numbers exist, and what drives them apart or together, reveals something genuinely important about how ETFs are built, and also about the regulatory history that has shaped modern fund disclosure.
This is the story of two prices, and why both of them matter.
A Little History: Why You See Both Numbers at All
Exchange-traded funds were introduced in the early 1990s. The structure was novel, and unlike a mutual fund, which investors buy and sell directly from the fund company at one daily price, an ETF trades on an exchange throughout the day just like a stock. That means at any moment, a buyer and a seller are agreeing on a price, and that price may or may not perfectly reflect what the underlying basket of securities is actually worth.
Regulators noticed the ambiguity immediately. They ultimately asked such questions as:
The answer evolved through the Security and Exchange Commission’s (SEC's) exemptive order process, meaning that each ETF launching before 2019 required individual SEC approval, and those orders consistently required disclosure of both NAV and market price as a condition of operation. This informal regime was finally codified in a single, unified framework under SEC Rule 6c-11 (Investment Company Act Release No. IC-33646, October 2019), which explicitly mandated daily website disclosure of NAV, market price, and the premium or discount between them.1
The requirement to show both numbers was a regulatory acknowledgment of a structural truth:
ETF shares live in two worlds simultaneously, specifically the portfolio world and the trading world.
What NAV Is Actually Measuring
The NAV is the portfolio price. It is calculated once per day, after the close of U.S. markets, by taking the total value of everything the fund holds, meaning every stock, bond, or other security, adding any accrued income, subtracting liabilities and fees, and dividing by the number of shares outstanding.
Think of it as asking: if you could liquidate this entire fund right now at fair prices and distribute the proceeds to shareholders equally, what would each share be worth? That number is the NAV.
What Market Price Is Actually Measuring
The market price is the trading price. It reflects what a buyer actually paid (or a seller actually received) for a share of the ETF on the exchange.
Per SEC disclosure requirements, the standardized market price return in fund reporting uses the midpoint of the bid-ask spread at the 4:00 p.m. EST market close, meaning the midpoint between what a buyer was willing to pay and what a seller was willing to accept at that moment.
Importantly, an investor who places a market order at 2:30 in the afternoon might execute at a slightly different price than the 4 p.m. midpoint used in the official return calculation.
The reported Market Price return is a standardized benchmark, not a record of any particular investor's experience.
Still, the Market Price return is important because it represents the reality of the exchange. If you bought shares at one 4 p.m. midpoint and sold at another, the Market Price return approximates your actual gain or loss, before commissions, but adjusted for how the market was valuing those shares at those specific moments.
So Why Do They Differ?
In a perfectly efficient world, NAV and Market Price would always be identical. But ETF shares are traded by humans and algorithms responding to information, sentiment, and supply and demand, while NAV is calculated from closing prices of the underlying holdings. Several forces can push the two apart:
The authorized participant arbitrage mechanism is one of the most important dynamics in modern markets, effectively, an invisible hand that quietly keeps two prices aligned.
Reading the Numbers: What to Look For
It makes sense to look at some real examples. What follows is all standardized performance as of March 31, 2026. We look at:
Let’s see if real differences are visible.
U.S. Case Study Across Large, Mid and Small Market Capitalization Equities
Across the WisdomTree U.S. Quality Dividend Growth Fund (DGRW), the WisdomTree U.S. MidCap Dividend Fund (DON), and the WisdomTree U.S. SmallCap Dividend Fund (DES), the spread between NAV and Market Price returns is remarkably tight, and this is a testament to the efficiency of the arbitrage mechanism for domestic equity ETFs where underlying holdings and fund shares trade in the same market, at the same time, in the same currency. DGRW shows the closest alignment. DON and DES follow a similar pattern, with some observations hitting the range of 6 to 15 basis point differences. The larger differences did concentrate within DES, the smallest market capitalization-focus of the three strategies. The 10-Year horizon, however, the two measures converge almost entirely, reinforcing that for U.S.-listed domestic funds, NAV and Market Price were expected to be quite close and that is what we have observed.
Figure 1: A Look at U.S. ETF Figures
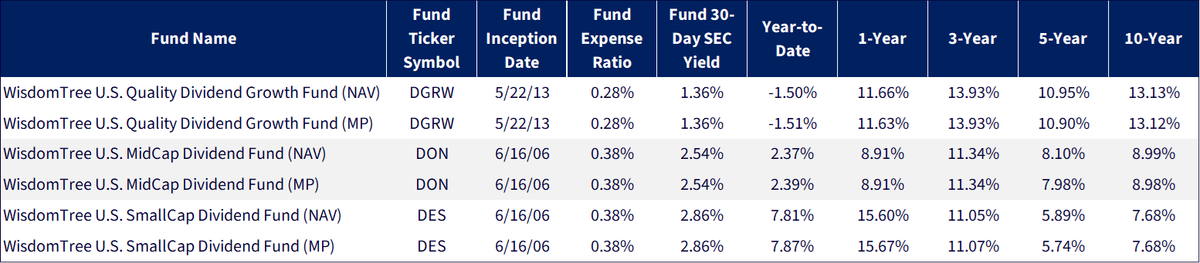
Sources: Morningstar, FactSet and WisdomTree, specifically data is from the PATH Fund Comparison Tool, accessed as of May 18, 2026, but showing returns for the period ended March 31, 2026. NAV denotes total return performance at net asset value. MP denotes market price performance. Past performance is not indicative of future results. Investment return and principal value of an investment will fluctuate so that an investor’s shares, when redeemed, may be worth more or less than their original cost. Current performance may be lower or higher than the performance data quoted. For the most recent month-end and standardized performance, click the relevant ticker: DGRW, DON, DES.
When underlying markets operate in different time zones from U.S. trading hours, the gap between NAV and Market Price returns can widen considerably, and nowhere is this more visible than in DXJ, the WisdomTree Japan Hedged Equity Fund. The Tokyo Stock Exchange closes before U.S. markets open, meaning DXJ shares trade throughout the American session against a NAV anchored to overnight Japanese closing prices. When significant news, call it currency moves, macro developments, or risk sentiment shifts, emerges during U.S. hours, the market price adjusts in real time while the NAV cannot. The result is the largest NAV-to-Market Price divergence in this group: a 10-year annualized gap of 36 basis points (16.48% NAV vs. 16.84% Market Price) and a striking 271-basis-point difference on the 1-year return (43.53% NAV vs. 46.24% Market Price). The WisdomTree International Hedged Quality Dividend Growth Fund (IHDG), the WisdomTree Europe Hedged Equity Fund (HEDJ), and the WisdomTree Dynamic International Equity Fund (DDWM) show similar dynamics at smaller magnitudes, reflecting the same structural reality: the more disconnected the underlying market's trading hours from U.S. hours, the greater the potential for NAV and Market Price to diverge.
Figure 2: A Look at Developed International Equity ETFs
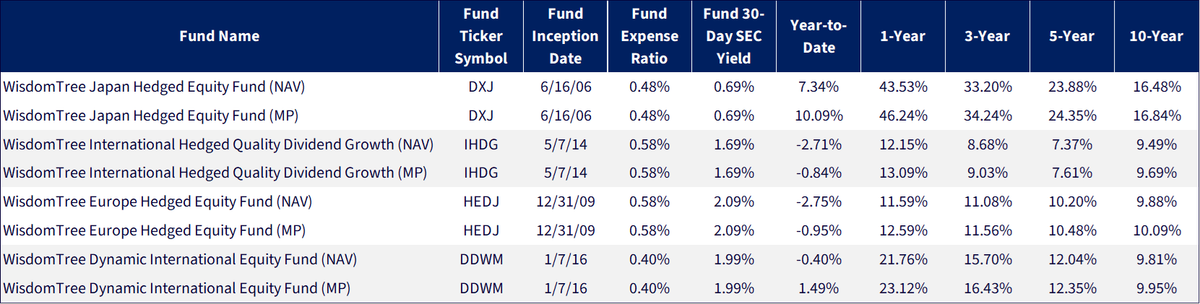
Sources: Morningstar, FactSet and WisdomTree, specifically data is from the PATH Fund Comparison Tool, accessed as of May 18, 2026, but showing returns for the period ended March 31, 2026. NAV denotes total return performance at net asset value. MP denotes market price performance. Past performance is not indicative of future results. Investment return and principal value of an investment will fluctuate so that an investor’s shares, when redeemed, may be worth more or less than their original cost. Current performance may be lower or higher than the performance data quoted. For the most recent month-end and standardized performance, click the relevant ticker: DXJ, IHDG, HEDJ, DDWM.
Emerging markets introduce the widest and most structurally complex NAV-to-Market Price divergences in the WisdomTree fund lineup, and the data here reflect that reality vividly. Multiple forces converge simultaneously:
The result is gaps that can appear larger than what we saw with domestic or even developed international funds. The WisdomTree Emerging Markets SmallCap Dividend Fund (DGS) shows a 1-year difference of 355 basis points (25.82% NAV vs. 29.37% Market Price), while the WisdomTree Emerging Markets High Dividend Fund’s (DEM) 1-year spread reaches 238 basis points (21.10% NAV vs. 23.48% Market Price). The WisdomTree India Earnings Fund (EPI) presents another notable stat: a Year-to-Date NAV return of -14.58% against a Market Price return of -11.86% — a 272-basis-point gap reflecting how rapidly Indian market sentiment and rupee dynamics were being repriced in U.S. trading hours relative to the prior night's official closing values. Across all four funds, the pattern is consistent: over longer time horizons the two measures converge, but in shorter windows, emerging markets expose the structural limits of end-of-day NAV pricing in ways that domestic funds simply do not.
Figure 3: A Look at Emerging Markets Equity ETFs
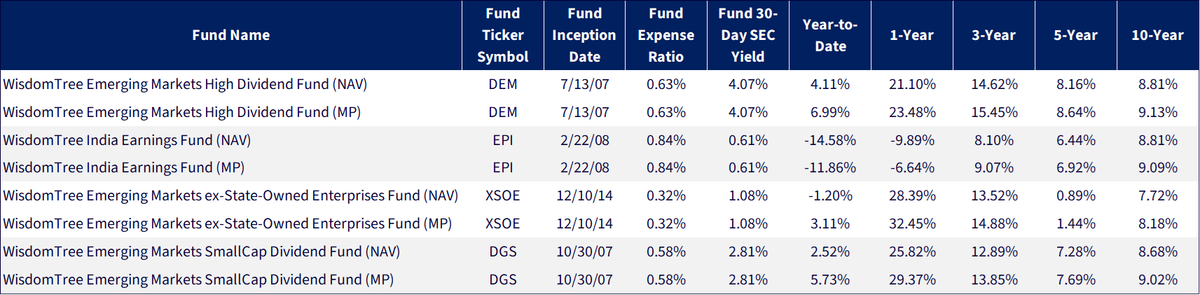
Sources: Morningstar, FactSet and WisdomTree, specifically data is from the PATH Fund Comparison Tool, accessed as of May 18, 2026, but showing returns for the period ended March 31, 2026. NAV denotes total return performance at net asset value. MP denotes market price performance. Past performance is not indicative of future results. Investment return and principal value of an investment will fluctuate so that an investor’s shares, when redeemed, may be worth more or less than their original cost. Current performance may be lower or higher than the performance data quoted. For the most recent month-end and standardized performance, click the relevant ticker: DEM, EPI, XSOE, DGS.
The Bottom Line
The existence of two prices for the same ETF is not redundancy, but rather it is transparency. Regulators required both figures to be disclosed precisely because they capture different things:
For most domestic equity ETFs, in most periods, the two numbers will be close. But in markets under stress, in funds holding hard-to-price assets, or in international funds spanning multiple time zones, the gap between them can become more meaningful, and this is a window into market sentiment, liquidity conditions, and the mechanics of how price discovery actually works in the real world.
1 Source: Here's the APA citation for SEC Rule 6c-11:
Securities and Exchange Commission. (2019, October 24). Exchange-traded funds (Release No. IC-33646; File No. S7-15-18). Federal Register, 84(206), 57162–57302.
There are risks associated with investing, including possible loss of principal.
DGRW: Growth stocks, as a group, may be out of favor with the market and underperform value stocks or the overall equity market. Growth stocks are generally more sensitive to market movements than other types of stocks.
DON: The fund invests primarily in the securities of mid-capitalization companies. As a result, the Fund's performance may be adversely affected if securities of these companies underperform securities of other capitalization ranges or the market as a whole.
DES: Funds focusing their investments on certain sectors and/or smaller companies increase their vulnerability to any single economic or regulatory development. This may result in greater share price volatility.
Foreign Investing
Foreign investing involves special risks, such as risk of loss from currency fluctuation or political or economic uncertainty.
See below for specific fund risks.
DXJ: The Fund focuses its investments in Japan, thereby increasing the impact of events and developments in Japan that can adversely affect performance.
IHDG: Growth stocks, as a group, may be out of favor with the market and underperform value stocks or the overall equity market. Growth stocks are generally more sensitive to market movements than other types of stocks.
HEDJ: This Fund focuses its investments in Europe, thereby increasing the impact of events and developments associated with the region which can adversely affect performance.
DDWM: The Fund invests in derivatives in seeking to obtain a dynamic currency hedge exposure. Derivative investments can be volatile, and these investments may be less liquid than other securities, and more sensitive to the effects of varied economic conditions.
DEM: Investments in emerging, offshore or frontier markets are generally less liquid and less efficient than investments in developed markets and are subject to additional risks, such as risks of adverse governmental regulation, intervention and political developments.
EPI: This Fund focuses its investments in India, thereby increasing the impact of events and developments associated with the region, which can adversely affect performance.
XSOE: Investments in emerging or offshore markets are generally less liquid and less efficient than investments in developed markets and are subject to additional risks, such as risks of adverse governmental regulation and intervention or political developments.
DGS: Funds focusing on a single sector and/or smaller companies generally experience greater price volatility. Investments in emerging, offshore or frontier markets are generally less liquid and less efficient than investments in developed markets and are subject to additional risks, such as risks of adverse governmental regulation, intervention and political developments.
Please read the each of the Funds’ prospectus for specific details regarding the Fund’s risk profile.


Global Head of Research
Christopher Gannatti began at WisdomTree as a Research Analyst in December 2010, working directly with Jeremy Schwartz, CFA®, Director of Research. In January of 2014, he was promoted to Associate Director of Research where he was responsible to lead different groups of analysts and strategists within the broader Research team at WisdomTree. In February of 2018, Christopher was promoted to Head of Research, Europe, where he was based out of WisdomTree’s London office and was responsible for the full WisdomTree research effort within the European market, as well as supporting the UCITs platform globally. In November 2021, Christopher was promoted to Global Head of Research, now responsible for numerous communications on investment strategy globally, particularly in the thematic equity space. Christopher came to WisdomTree from Lord Abbett, where he worked for four and a half years as a Regional Consultant. He received his MBA in Quantitative Finance, Accounting, and Economics from NYU’s Stern School of Business in 2010, and he received his bachelor’s degree from Colgate University in Economics in 2006. Christopher is a holder of the Chartered Financial Analyst Designation.