


The NASDAQ's Troubles May Be Early Days
Published February 8, 2022

Jeff Weniger, CFA
Head of Equity Strategy
How do you quantify how speculative the market became before this winter’s decline?
As stocks marched inexorably higher through 2020 and 2021—after, ahem, running for 11 years prior to that—I think many people retired as soon as their IRA hit their “number.”
But how many people are we talking about? Your guess is as good as mine. Whatever the figure, we can add to them some other groups: people who made fortunes in crypto, or 10 times their money in Tesla. No doubt about it, many dropped out of the labor force.
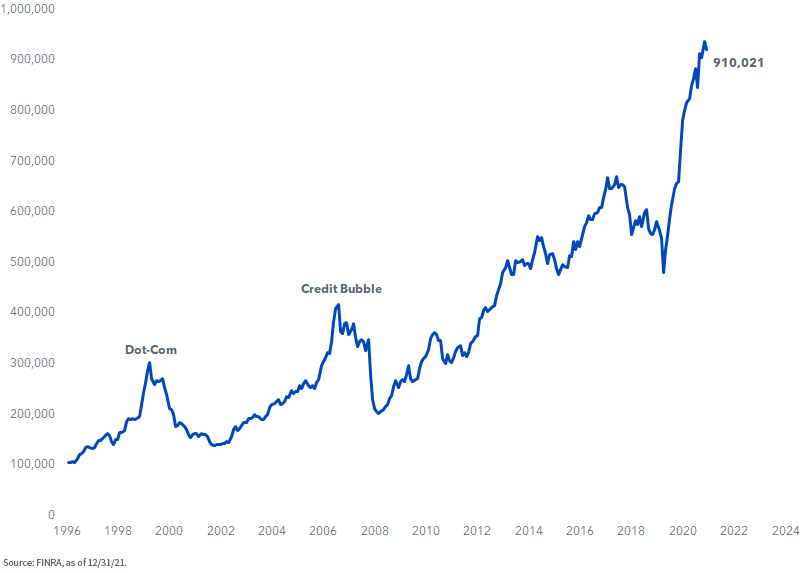
What we do know, if we are looking to put a number on these things, is that brokerage account margin debt melted up to $910 billion in December (figure 1). My concern is that a lot of this money is in securities like AMC and GameStop, in growth funds…or NASDAQ trackers.
If you squint at the final tick in figure 1, the peak was in November. The January data isn’t in yet, but rest assured, people are getting margin calls.
Figure 1: Debit Balances in Customers’ Securities Margin Accounts ($ mil.)
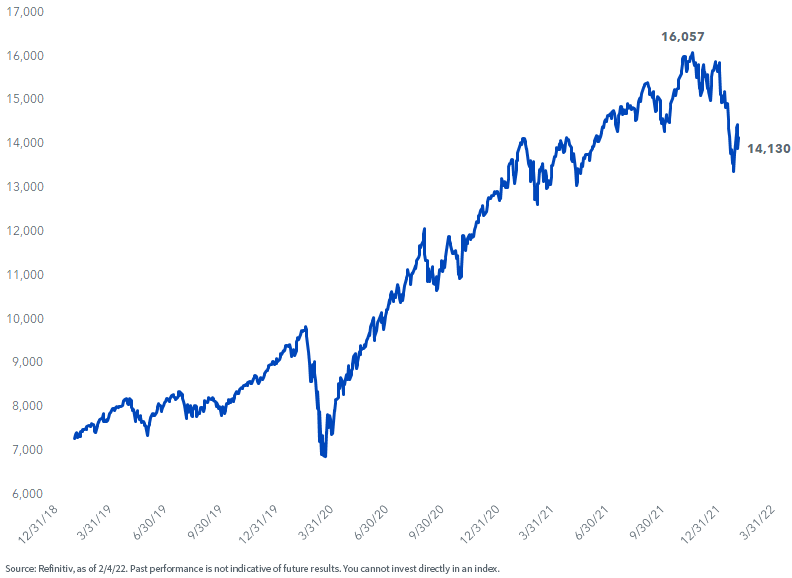
The situation in the NASDAQ Composite is not pretty, with a decline from 16,057 on November 19, 2021, to current levels around 14,000 (figure 2).
Figure 2: NASDAQ Composite
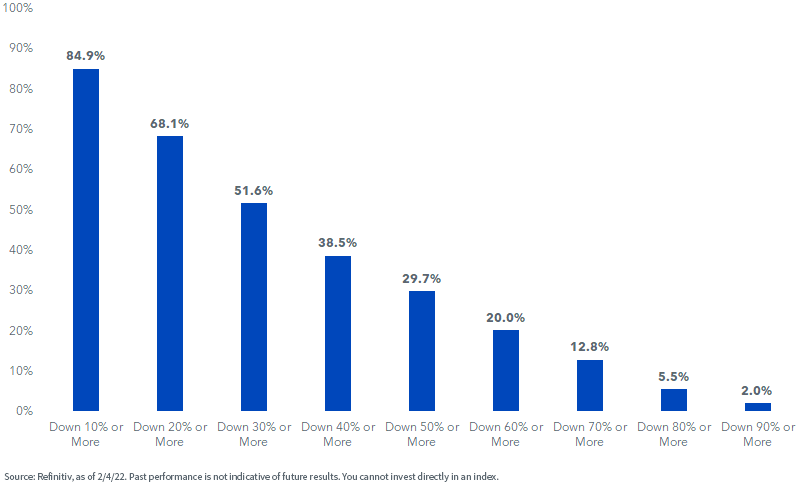
As bad as that looks, many companies have been hit harder. More than 29% of the NASDAQ’s components have halved from their 52-week highs (figure 3).
Figure 3: NASDAQ Composite % Constituents Showing Declines from 52-Week Highs
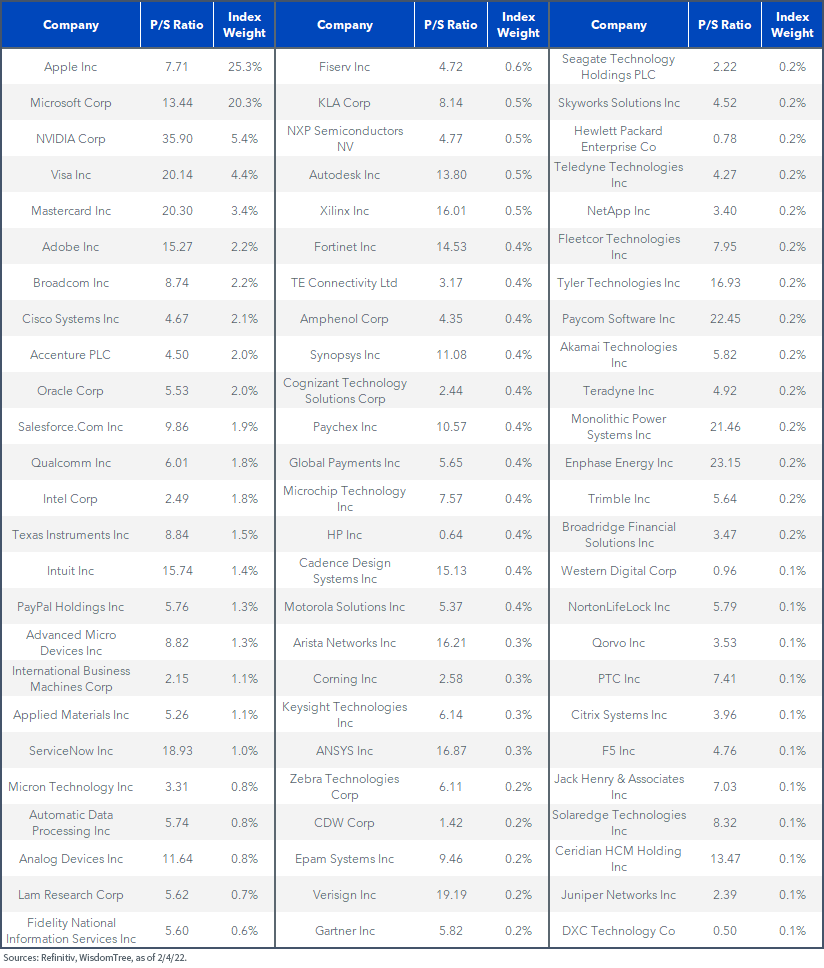
At the peak of the 1990s bubble, the S&P 500 Information Technology sector traded for 6.8 times sales. Look at how many stocks are trading above that level, even after recent declines (figure 4).
Figure 4: S&P 500 Information Technology Constituents’ Price-to-Sales (P/S) Ratio
An argument I often hear to defend today’s large-cap growth stocks is that few companies in the “Class of 1999” had viable business models, or profits for that matter.
Not true.
Okay, there were tons of silly dot-coms in that market, but they were sideshows. The NASDAQ’s top 10 by market cap back then were (from smallest to largest): JDS Uniphase, Applied Materials, Yahoo, Qualcomm, Dell, Sun Microsystems, Oracle, Intel, Cisco and Microsoft.
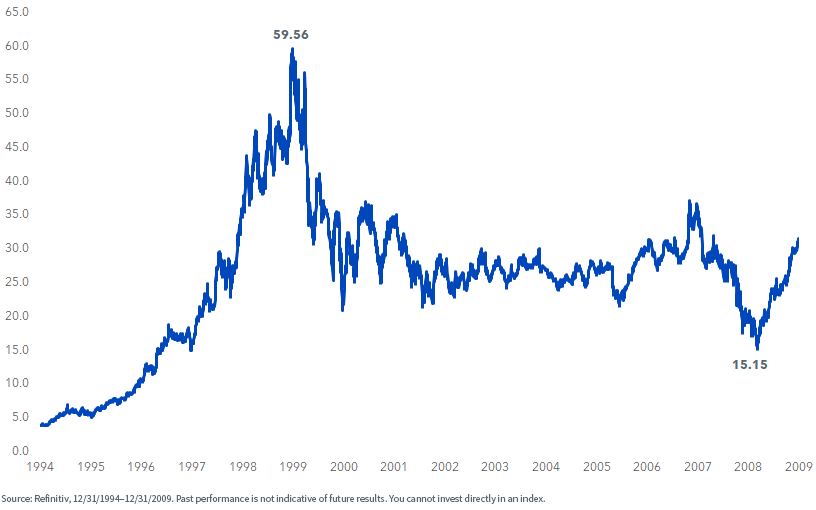
Consider the biggest one, Microsoft. Like today, Microsoft was a great company in 1999. A great company at a horrible price. In the fiscal years from 1996 to 2000, Microsoft posted annual earnings of $0.43, $0.66, $0.84, $1.42 and finally, $1.70.
Somebody paid $59 for that stock in 1999, or 35 times forward earnings. You can buy great companies all you wish, but if you pay too much, you get a rotten egg (figure 5).
Figure 5: Microsoft Stock Price, Tech Bubble through Global Financial Crisis
Investors often ask me to pick one of our strategies that I think can thrive if the whole market gets a dose of sobriety, with the good being taken out with the bad.
An idea is the WisdomTree U.S. Value Fund (WTV). It screens for net buyback yield, coming up with a basket that yields 5.61% on that score.
To visualize it, a 5.61% buyback yield is the equivalent of a $10 billion company going into the market and buying back $561 million worth of its shares in any given year. It is considerably larger than the 1.36% net buyback yield on the S&P 500.
WTV does own Tech stocks, but they aren’t the “hot” favorites of speculators. Even with 12% in the Tech sector, WTV’s collective forward P/E ratio is just 12.2. Not exactly Reddit message board stuff. It seems to me a good way to battle through 2022.
Important Risks Related to this Article
There are risks associated with investing, including the possible loss of principal. Funds focusing their investments on certain sectors increase their vulnerability to any single economic or regulatory development. This may result in greater share price volatility. While the Fund is actively managed, the Fund’s investment process is expected to be heavily dependent on quantitative models and the models may not perform as intended. Please read the Fund’s prospectus for specific details regarding the Fund’s risk profile.
WTV was formerly the WisdomTree U.S. Quality Shareholder Yield Fund (QSY).
References to specific securities and their issuers are for illustrative purposes only and are not intended to be, and should not be interpreted as, recommendations to purchase or sell such securities.
Categories
Related articles

Behind the Charts: Is the Energy Trade Running Out of Fuel?

Oil Markets Face a Supply Shock—and the Offsets Aren’t Enough

Tariffs Are (Sort of) Done: What the Supreme Court Ruling Means for Markets

7 Market Dislocations Too Big to Overlook
Mag 7 Components Turning Value? The Russell Shuffle
The Other Side of Tariffs

Why the Iran Situation Is a Valuable Lesson
A Goldilocks Inflation Moment, Tariffs and All
Mostly Dead: The Twilight of Price over Volume
About the contributor

Jeff Weniger, CFA
Head of Equity Strategy
Jeff Weniger, CFA, has been with WisdomTree since 2017 and serves as the Head of Equities. He shapes the firm’s market outlook through a combination of macroeconomic and fundamental analysis. With more than two decades in investment strategy, Jeff is known for his work on market cycles and valuations. Before joining WisdomTree, Jeff was with BMO Private Bank and BMO Global Asset Management for 11 years. At BMO, he sat on the firm’s Asset Allocation Committee and co-managed ETF model portfolios across the U.S. and Canada. In 2013, at age 32, he became the youngest member of BMO’s Global Investment Forum. When he left BMO to come to WisdomTree, his final role was Director, Senior Strategist in the Office of the CIO in 2017.
Jeff is a frequent television guest on networks such as CNBC, Bloomberg, and Schwab, with regular print appearances in The Wall Street Journal, Barron’s and Reuters. He also appears weekly on the Behind the Markets podcast and is a regular on SiriusXM’s The Business Briefing. On X, Jeff has developed one of the larger followings in financial media. He earned a B.S. in Finance from the University of Florida and an MBA from the University of Notre Dame. He has held the CFA charter since 2006.