

Behind the Charts: Is the Energy Trade Running Out of Fuel?
Published April 16, 2026

Christopher Gannatti, CFA
Global Head of Research
Key Takeaways
- Energy equities have surged to historically strong momentum and positioning levels above long-term trends, suggesting the “early gains” are likely behind us and investors may consider trimming exposure or rotating within the sector.
- If oil prices begin a gradual normalization, beaten-down sectors like consumer discretionary as well as fixed income asset classes could benefit, creating a tactical opportunity for investors to rebalance toward laggards poised for a second leg higher.
- With cash allocations spiking and sentiment washed out, markets may be closer to a bottoming process than peak risk, reinforcing a contrarian case for selectively adding equity exposure as leadership broadens beyond crowded trades.
Recorded live on April 10, 2026, this Behind the Markets episode—“Behind the Charts”—features Macro Charts (MC) unpacking a market defined by shifting leadership, extreme positioning, and a critical inflection in energy. What follows is a distilled view of his framework and highest-conviction signals.
Hearing from a Disciplined Trend-Follower
MC’s core message was that he approaches markets as a disciplined trend follower, not as a macroeconomic forecaster. He repeatedly emphasized that his job is to listen to price action, identify dislocations between what people believe and what markets are actually doing, and then allocate capital with a tight focus on risk control. MC is not trying to predict every twist of the news cycle. Instead, he looks for the biggest trends, the moments when a move is becoming crowded or exhausted, and the places where risk-reward has become potentially asymmetric. That framework explains why he keeps revisiting sectors and themes as conditions evolve rather than locking into one permanent view.
The ‘Energy Trade’ has Done its Job
A major theme of the conversation was energy. MC made clear that he thinks the ‘energy trade’ has largely done its job. He described being heavily involved in the move higher, but now believes the best part of the upside may be behind us. His view is not that energy becomes irrelevant from this point, but that the market is now closer to a topping phase than a fresh beginning.
MC supplied us with the following three figures to share, which give a further look at how he has shaped his thinking on the aforementioned ‘energy trade.’
Figure 1 highlights how extended the S&P Energy sector has become relative to its long-term trend, using the percentage distance above the 200-day moving average as a proxy for momentum and crowding. Historically, when this measure spikes to elevated levels, as seen in prior cycles around the mid-2000s and post-2020, energy has already experienced a significant run, often entering a late-stage phase rather than the beginning of a new move. The current reading shows a similarly stretched condition, suggesting that the recent rally has been both strong and potentially crowded. While this does not imply an immediate reversal, it does signal that forward returns may become more volatile and dependent on consolidation or a reset in positioning. In a broader portfolio context, such extremes often coincide with peak narrative strength and may precede rotation into lagging sectors as the energy trade matures.
Figure 1: Energy at Extremes: S&P Energy Sector Stretches Far Above Long-Term Trend
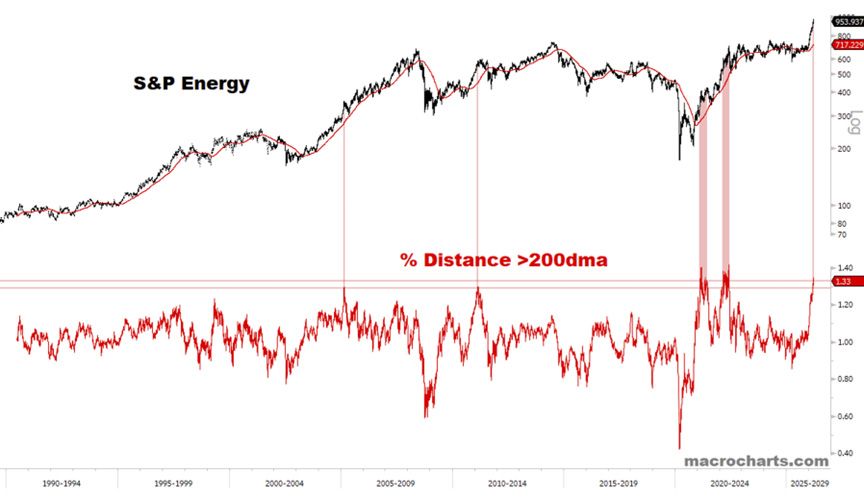
Sources: Re-posted with permission from the macrocharts.com substack. ‘S&P Energy’ refers to the universe of companies within the GICS Energy sector from within the S&P 500 Index. This indicator measures how far a price is above its 200-day moving average, expressed as a percentage, helping identify overbought conditions, trend strength, and potential mean reversion or market extremes. Past performance is not indicative of future results.
Figure 2 pairs the long-term trajectory of the S&P Energy sector with its 3-month rate of change, offering a clear view of momentum cycles within the broader trend. Periods highlighted in the chart show that when short-term gains spike to extreme levels, they tend to occur after a sustained move higher—not at the beginning of a rally. The current surge in 3-month returns stands out as one of the strongest in decades, aligning with prior episodes where energy experienced rapid, late-stage acceleration. Historically, these bursts of momentum often coincide with peak enthusiasm and crowded positioning, rather than durable entry points. While strong momentum can persist longer than expected, it typically signals that the easy gains have already been realized. From a tactical perspective, this kind of setup suggests increasing sensitivity to negative surprises and a higher likelihood of consolidation, volatility, or rotation as the energy trade matures.
Figure 2: Energy Momentum Surge: 3-Month Gains Signal Late-Cycle Acceleration
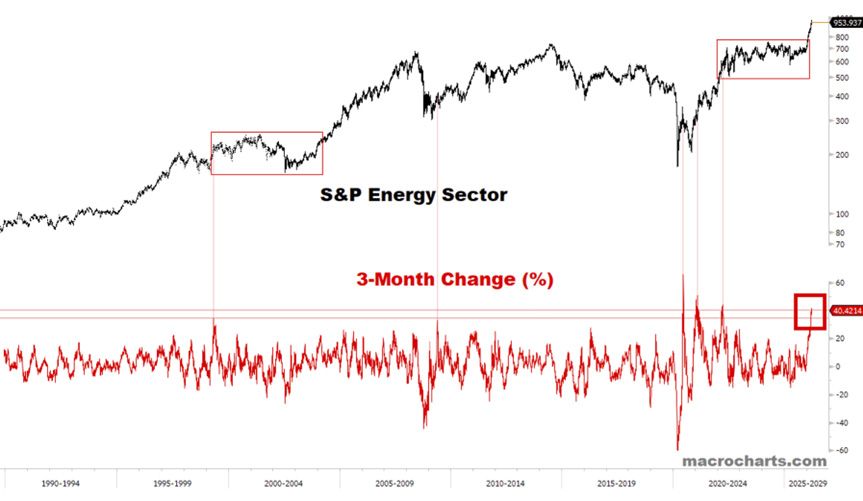
Sources: Re-posted with permission from the macrocharts.com substack. ‘S&P Energy’ refers to the universe of companies within the GICS Energy sector from within the S&P 500 Index. 3-month Change shows how much the sector’s price has risen or fallen over the past three months. Traders use it to spot momentum, trend strength, and possible exhaustion points early. Past performance is not indicative of future results.
This chart shows the S&P Energy sector relative to the broader S&P 500, paired with its 3-month rate of change, highlighting both trend leadership and momentum extremes. The key signal is the recent surge in short-term performance, which has reached a new all-time high in 3-month change. Historically, such spikes in relative momentum have occurred during sharp catch-up rallies or late-stage bursts of outperformance, rather than at the beginning of sustained leadership cycles. While energy has clearly regained relative strength after a prolonged period of underperformance, the magnitude and speed of the recent move suggest increasingly crowded positioning. These conditions often coincide with peak narrative conviction and can precede periods of consolidation or mean reversion. In this context, the chart reinforces the idea that while energy leadership has been powerful, the asymmetry may now be shifting as relative momentum reaches extreme levels.
Figure 3: Energy vs. Market: Record Momentum Signals Peak Relative Strength
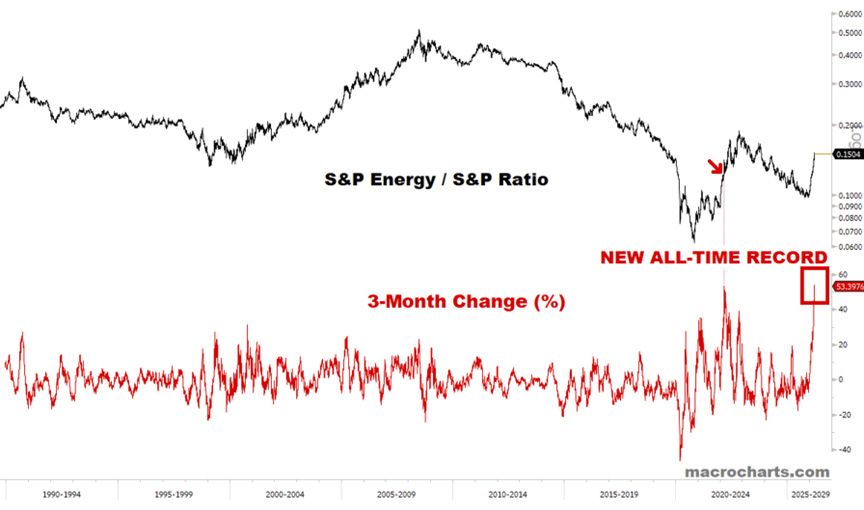
Sources: Re-posted with permission from the macrocharts.com substack. ‘S&P Energy’ refers to the universe of companies within the GICS Energy sector from within the S&P 500 Index. S&P refers to the S&P 500 Index. The ratio is designed so an upward move signals Energy outperforming, whereas a downward move signals Energy underperforming. 3-month Change shows how much the sector’s price has risen or fallen over the past three months. Traders use it to spot momentum, trend strength, and possible exhaustion points early. Past performance is not indicative of future results.
Looking through Energy to the Oil Price
MC also sees the possibility of a broader normalization process in the price of oil, but thinks that process will be messy and slow rather than clean and immediate. Because energy prices affect almost everything else, he framed oil as the central variable for the rest of the year. If oil rolls over or stabilizes, that could ripple through bonds, the consumer discretionary sector, international equities, and even inflation expectations.
That leads to one of his most interesting cross-asset ideas: if oil is peaking, then some of the market’s other beaten-up areas may finally have room to work. He was constructive on the consumer discretionary sector, arguing that it had been sold off aggressively and could benefit from a normalization in oil prices. He also said bonds can work in the same environment, which is a useful reminder that markets do not always behave in the simplistic “risk-on versus risk-off” way people expect. In his view, a combination of underinvestment, systematic buying, and positioning flushes may already have created a floor beneath the market, even if volatility remains high.
Broader Views on Equities
On the equity side, MC was careful to distinguish between what has already run and what still looks underappreciated. He suggested that parts of software and Software-as-a-Service (SaaS) may still have a second act, especially if the market broadens beyond the early leaders. He also liked Meta Platforms and Alphabet, not because he thinks they need to become generic AI winners, but because their AI capabilities can improve their core advertising businesses. In other words, he sees AI not as a standalone narrative, but as a tool that deepens the competitive moat of the best ad platforms. He made a similar point about valuation: big-tech multiples have compressed enough that these stocks are no longer obviously stretched in terms of their valuations relative to the broader market.
Going Beyond U.S. Borders
Internationally, MC pointed to the importance of oil for emerging markets and Asian economies, especially Japan, Korea, and China. His view was that a normalization in oil could provide meaningful relief in those regions, but investors may be too early if they try to buy only after the news is clearly good. The market, in his telling, usually moves before the story feels safe. He also thought that the current environment could be difficult for bears during earnings season, because positioning looks washed out, sentiment is poor, and many investors are underexposed. Overall, his message was pragmatic rather than heroic: be flexible, respect trends, focus on price, and look for the next pocket of opportunity as the current one matures.
Conclusion: Closer to Opportunity than Peak Risk
This chart tracks flows into money market and cash-like ETFs alongside the S&P 500, offering a window into investor positioning during periods of stress. Historically, sharp spikes in cash allocations have coincided with moments of heightened uncertainty, risk aversion, and, importantly, market inflection points. These surges often reflect a broad “de-risking” impulse, in other words investors stepping to the sidelines after volatility or drawdowns. The current spike stands out as one of the more pronounced in recent years, suggesting a meaningful level of underinvestment and defensive positioning. From a contrarian perspective, these episodes frequently align with market bottoms or bottoming processes, as selling pressure becomes exhausted and sidelined capital creates latent buying power. While not a precise timing tool, the signal reinforces a key takeaway: when fear drives large reallocations to cash, the market is often closer to opportunity than to peak risk.
Figure 4: Capitulation or Caution? Cash Flows Surge as Markets Search for a Floor
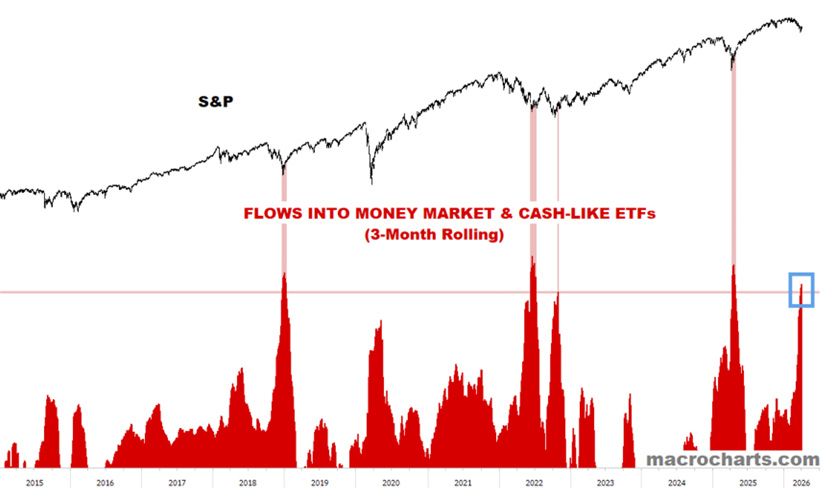
Sources: Re-posted with permission from the macrocharts.com substack. ‘Cash-Like’ ETFs references ETFs that are not directly qualified as ‘money market’ funds but that are characterized by extremely low volatility in their net asset values. Past performance is not indicative of future results.
Listen to the full conversation here or below.
About the contributor

Christopher Gannatti, CFA
Global Head of Research
Christopher Gannatti began at WisdomTree as a Research Analyst in December 2010, working directly with Jeremy Schwartz, CFA®, Director of Research. In January of 2014, he was promoted to Associate Director of Research where he was responsible to lead different groups of analysts and strategists within the broader Research team at WisdomTree. In February of 2018, Christopher was promoted to Head of Research, Europe, where he was based out of WisdomTree’s London office and was responsible for the full WisdomTree research effort within the European market, as well as supporting the UCITs platform globally. In November 2021, Christopher was promoted to Global Head of Research, now responsible for numerous communications on investment strategy globally, particularly in the thematic equity space. Christopher came to WisdomTree from Lord Abbett, where he worked for four and a half years as a Regional Consultant. He received his MBA in Quantitative Finance, Accounting, and Economics from NYU’s Stern School of Business in 2010, and he received his bachelor’s degree from Colgate University in Economics in 2006. Christopher is a holder of the Chartered Financial Analyst Designation.