


November Dividend Update
Published December 3, 2021

Matt Wagner, CFA
Director, Research
History doesn’t repeat, but it often rhymes.
This is what a recent Bank of America research note1 implies about the current U.S. equity market environment relative to 1999.
The BofA valuation framework suggests a -0.5% annualized price return for the S&P 500 over the next 10 years. The last time that framework forecasted a negative return? 1999.
Isolating Dividend Returns
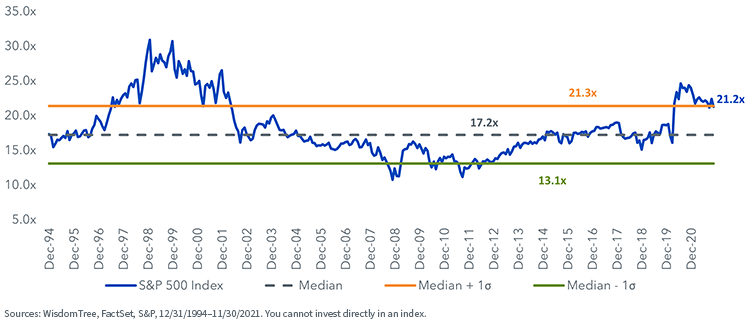
Robust earnings growth has reduced valuations this year, but the S&P 500 forward price-to-earnings (P/E) ratio of 21.2x is still around one standard deviation above its historical median.
S&P 500: Index Forward P/E Ratio
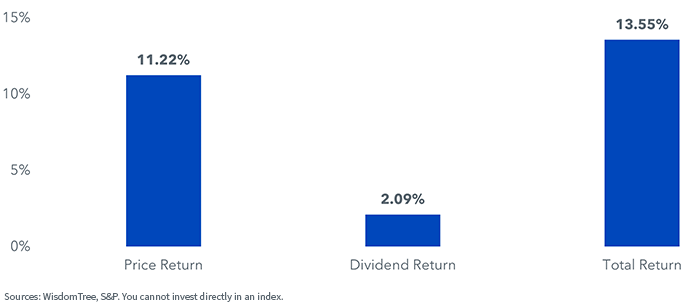
In the decade immediately following the global financial crisis, the starting forward P/E ratio was less than 16x. That allowed for multiple expansions to contribute to price returns on the Index of more than 11% annualized for the next decade. The dividend return provided an additional 2%.
S&P 500 Returns: 12/31/09–12/31/19
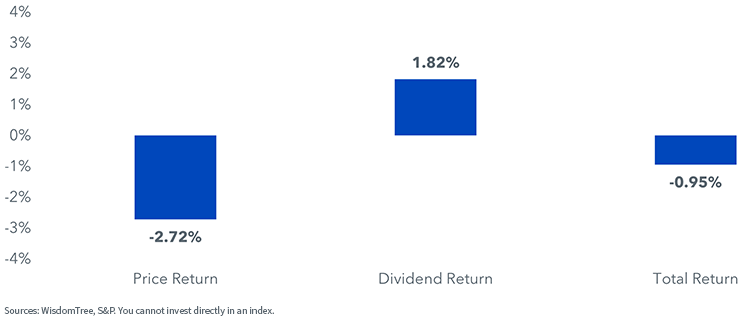
Recency bias tends to cause us to extrapolate recent experiences into the future. But a better reference point for the current environment could be the period of the 2000s, where the price return on the Index was -2.72%.
The 1.82% annualized return from dividends helped cushion some of the negative price return, resulting in a not-so-impressive -0.95% total return.
S&P 500 Returns: 12/31/1999–12/31/2009
As BofA puts it: “Total return is the number to optimize, and we see dividend preservation and growth as the single most important criteria for stock selection, which could potentially be the difference between a flat-to-negative and positive return over the next 10 years in the S&P 500.”1
Dividend Growth
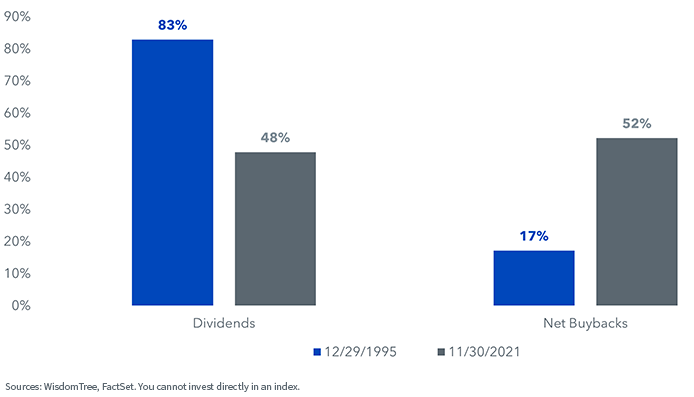
Share buybacks have become an increasingly popular form of cash payouts relative to dividends. In 1995, dividends made up more than 80% of cash payouts. Today, payouts are roughly even between share buybacks and dividends.
S&P 500: Percentage of Payout by Source
There are a few key factors supporting dividend growth relative to buybacks for investors to keep in mind:
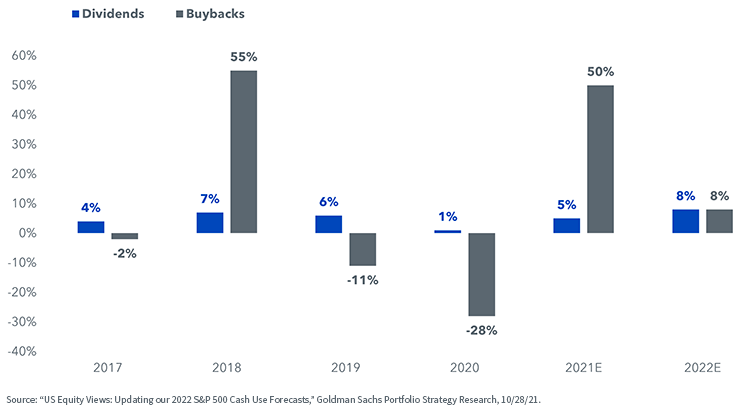
- Dividends are less volatile—In 2020, S&P 500 earnings were down 13%. In the face of a recession, dividend growth was slightly positive, while buybacks were down 28%. Buybacks are pro-cyclical, whereas U.S. companies typically aim to avoid dividend cuts at all costs.
- Taxes—The Democrats’ latest proposed tax plan includes a 1% tax on corporate buybacks. While small, this may signal a bigger tax bill on buybacks to come.
- Valuations—With valuations at historically elevated levels, buybacks may not represent the greatest use of companies’ cash, which instead favors dividends.
S&P 500: Dividend and Buyback Growth
WisdomTree U.S. Quality Dividend Growth Index
Dividend preservation and growth are at the heart of the construction of the WisdomTree U.S. Quality Dividend Growth Index.
Dividend payers with sustainable dividend payout ratios (dividend yield < earnings yield) are initially eligible.
The 300 companies with the strongest combined return on equity/return on assets and earnings growth estimates are then selected, to target profitable companies that are more likely to maintain/grow their dividends.
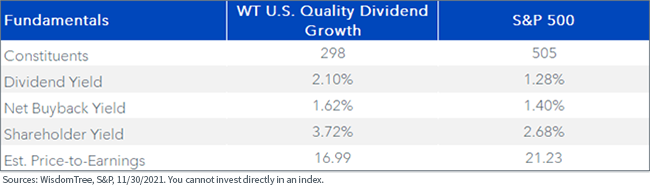
With the dividend return component of total returns in focus in this elevated valuation environment, this basket has a dividend yield premium of more than 80 basis points (bps). Its combined shareholder yield (dividend yield plus net buyback yield) is a roughly 100 bps improvement.
Index Fundamentals
1 “US Equity Strategy in Pictures: Investing for 4Q and beyond,” Bank of America Global Research, 10/26/21.
Categories
Related articles

NVIDIA to Become the Second-Largest U.S. Dividend Payer

Dividend Growth Is Not One Strategy

Beyond Market Cap: A Nearly 19-Year Case for Dividend-Driven Emerging Markets
Quality as a Foundation in an Uncertain World
Value Isn’t What It Used to Be
Don’t Mistake Speculation for Strength: The Mirage of Small-Cap “Junk” Outperformance
From Momentum to Discipline: Navigating Volatility in Emerging Markets
A Rebalance Review for U.S. Large-Cap Dividends
The Discipline of Dividends: Capturing Value in U.S. Large Caps
About the contributor

Matt Wagner, CFA
Director, Research
Matt Wagner joined WisdomTree in May 2017 as an Analyst on the Research team. He currently serves as a Director, where he supports the creation, maintenance, and reconstitution of WisdomTree’s indexes and actively managed ETFs. Matt began his career at Morgan Stanley, working as an analyst in Treasury Capital Markets from 2015 to 2017, focusing on unsecured funding planning, execution, and risk management. He graduated magna cum laude from Boston College in 2015 with a B.A. in International Studies, concentrating in Economics. In 2020, he earned a Certificate in Advanced Valuation from NYU Stern. He is also a Chartered Financial Analyst (CFA) charterholder.