
EPI
India Earnings Fund

Published August 19, 2026

Global Head of Research
Investors who follow emerging markets know that India rarely offers a tidy entry point. Valuations tend to price in optimism well in advance; domestic structural growth is well-understood and widely owned. So when we observe multiple cyclical and fundamental factors turning constructive at the same time, all while foreign positioning remains unusually light, it is worth pausing and looking carefully.
That moment is possibly happening now.
One of the most useful near-term signals for any equity market is the ratio of earnings upgrades to downgrades. A high upgrade ratio tells you that reality is beating expectations, and that analysts are revising their models upward in response. For the June 2026 earnings season in India, that ratio is running at one of its best levels in more than three years.
Across the roughly 125 Indian companies covered by Jefferies equity research that had reported June quarter results at the time of this writing, approximately 58% saw fiscal year 2027 earnings estimates revised higher, compared to only 37% seeing cuts, one of the strongest upgrade ratios in more than three years. What is particularly notable is where the upgrades are coming from. It’s not just a handful of market heavyweights, but a broad set of sectors including private banks, non-bank financials, real estate, cement and autos. Breadth of earnings revisions signals a recovery that is not being carried by one or two industries.1
Taken together, 14% earnings-per-share growth for Indian equities in fiscal year 2027 appears achievable, an improvement of roughly 4 percentage points over recent years.1
Bank credit growth in India has rebounded sharply, from a trough of around 9% in mid-2025 to approximately 17–18% currently, a pace not seen in over a decade. The acceleration is being driven primarily by corporate lending across sectors like oil, chemicals, power infrastructure and non-bank financials, reflecting genuine working capital needs and commodity-linked demand. 1
The deposit side of the ledger has lagged, but the Reserve Bank of India’s Foreign Currency Non-Resident bank measures, designed to attract foreign currency deposits, have drawn roughly $30 billion in inflows since June 2026 and are expected to support deposit growth by 2–3 percentage points. Strong credit growth, with deposit growth catching up, is a healthy configuration for Indian financials and for the broader economy. 1
Two consumption-sensitive sectors, autos and residential real estate, have been sending constructive signals simultaneously, which is meaningful.
On the auto side, passenger vehicle and two-wheeler sales have sustained strong momentum since Goods & Services Tax (GST) rate reductions in September 2025.2 Year-over-year volume growth for passenger vehicles and two-wheelers through mid-2026 has been running in the 20%+ range, with July 2026 data tracking even higher for two-wheelers. This is not a one-quarter bounce; it reflects a genuine improvement in consumer confidence and purchasing power. 1
Residential real estate across India’s top seven cities has also picked up, with area sold rising 8% in the first half of 2026 compared to essentially flat volumes through all of 2025. Bangalore and Mumbai have been the standout markets. Construction activity, visible in strong cement and steel volume data, is corroborating the housing figures. Premiumization continues as well, with the average unit area sold rising approximately 7% year-over-year. 1
India’s monsoon season began poorly, with rainfall running roughly 40% below normal in June 2026. This raised legitimate concerns about agricultural output, rural income and food inflation. July brought a meaningful reversal, and rainfall came in approximately 3% above normal, thereby narrowing the cumulative seasonal deficit to around 13%.1
With roughly half the monsoon season still remaining, the trajectory matters more than the current deficit. Reservoir levels across the country remain broadly in line with 20-year averages, partly due to carry-forward effects from two consecutive years of excess rainfall. The agricultural picture is not without risk, but it is considerably less alarming than it appeared in June.
India's power demand growth rebounded sharply in the April–July 2026 period, running at nearly 9% year-over-year, well above the 1–2% growth seen in early 2026. The combination of below-normal monsoon (which reduces hydropower output) and elevated temperatures has driven this acceleration. For power infrastructure investors and for the utilities sector broadly, the demand environment is supportive.3
Perhaps the most underappreciated dynamic in Indian equities right now is how light foreign positioning remains. Across a large sample of active emerging market funds, India is running approximately 0.2 percentage points underweight relative to benchmark, and this is significantly below the 10-year average positioning level. Roughly 64% of EM funds are currently underweight India versus their benchmark weight. 1
This means the recent improvement in fundamentals has not yet been chased by capital flows. Foreign portfolio investors turned net buyers of Indian equities in July 2026, adding approximately $2 billion, a positive directional shift, but still modest relative to the positioning gap that exists. 1
India’s beta to the broader has also declined meaningfully over time, running at roughly 0.5–0.6x. This lower volatility profile, combined with light positioning, creates the possibility for an asymmetric setup, as investors who are underweight have room to add without chasing a crowded trade.1
No honest assessment of Indian equities can ignore valuations, and we will not. MSCI India trades at approximately 20x one-year forward earnings, broadly in line with its 10-year average of roughly 19.8x. On that basis, the index is not cheap, but it is not obviously stretched either. 1
The more nuanced picture emerges at the stock level. Approximately 34% of MSCI India’s index weight trades at valuations more than 10% below historical averages, a meaningful pool of opportunities for active or factor-oriented strategies. Another 44% trades above historical averages, reflecting concentrated premium pricing in well-known compounders. The remaining 22% trades within a normal range. 1
Many investors have been looking at the positive story of India and undergoing the cognitive dissonance of having to pair that with the more recently challenging equity market performance. As is clear in Figure 1a:
No one can say for sure that ‘this is the turn’, but we would just note that shifts and changes to trends have to start somewhere. After the performance difficulties, seeing the aforementioned positive catalysts with this current, 1-Month period results, we think it’s worth at least paying initial attention.
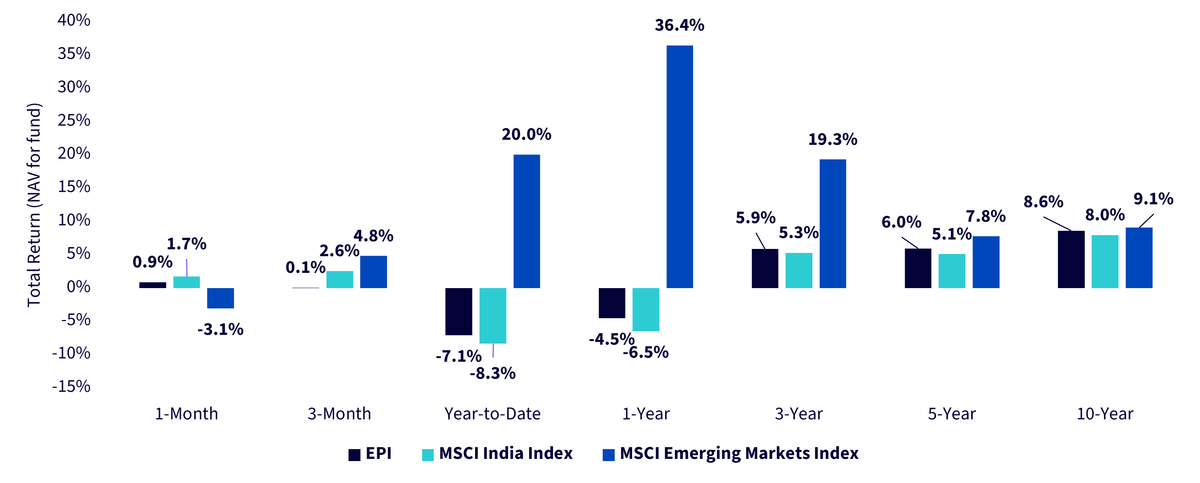

Sources: WisdomTree, Morningstar, FactSet, specifically data from the Fund Comparison Tool in the PATH suite of tools, accessed August 3, 2026 with returns for Figure 1a as of July 31, 2026 and for Figure 1b as of June 30, 2026. NAV denotes total return performance at net asset value. MP denotes market price performance. Past performance is not indicative of future results. Investment return and principal value of an investment will fluctuate so that an investor’s shares, when redeemed, may be worth more or less than their original cost. Current performance may be lower or higher than the performance data quoted. For the most recent month-end and standardized performance and to download the respective Fund prospectuses, click here.
We also noted the discussion of India’s equity valuations. EPI always leaps to mind in these discussions, or at least it should, because when you weight companies on the basis of their earnings as opposed to their market capitalization, you should tend to lower valuation metrics like the price-to-earnings ratio that focus on measuring valuation relative to earnings. Figure 2 shows how EPI’s forward price-to-earnings ratio was 16.3x, whereas the MSCI India Index’s was 20.3x. The MSCI Emerging Markets Index is at 11.2x, but we would note that India’s equities do tend to trade more expensively than broad emerging markets equities because market participants see the faster relative growth of India’s economy.
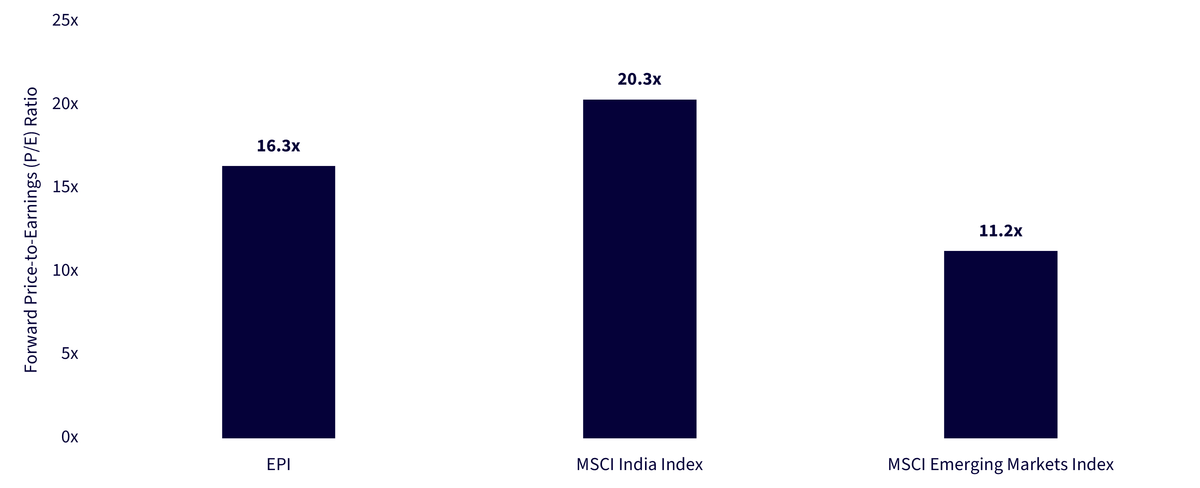
Sources: WisdomTree, Morningstar and FactSet, with data as of June 30, 2026. Past performance is not indicative of future returns.
1 Source: Nandurkar, M., Sinha, A., & Shah, P. (2026, August 3). Confluence of factors favouring India (Equity Strategy Report). Jefferies India Private Limited.
2 Source: GST Council. (2025, September 3). Recommendations of the 56th meeting of the GST Council [Press release]. Press Information Bureau, Government of India.
3 Source: Central Electricity Authority. (2026). Dashboard [Data dashboard]. Ministry of Power, Government of India.
4 The WisdomTree India Earnings Fund (EPI) is designed to track the total return performance of, before fees and expenses, the WisdomTree India Earnings Index. Constituents must have positive earnings to gain inclusion, and weighting is based on earnings, not market capitalization.
There are risks associated with investing, including possible loss of principal. Foreign investing involves special risks, such as risk of loss from currency fluctuation or political or economic uncertainty. This Fund focuses its investments in India, thereby increasing the impact of events and developments associated with the region, which can adversely affect performance. Investments in emerging, offshore or frontier markets such as India are generally less liquid and less efficient than investments in developed markets and are subject to additional risks, such as risks of adverse governmental regulation and intervention or political developments. The Fund invests in the securities included in, or representative of, its Index regardless of its investment merit and the Fund does not attempt to outperform its Index. The composition of the Index is governed by an Index Committee and the Index may not perform as intended. Please read the Fund’s prospectus for specific details regarding the Fund’s risk profile.
India Earnings Fund


Global Head of Research
Christopher Gannatti began at WisdomTree as a Research Analyst in December 2010, working directly with Jeremy Schwartz, CFA®, Director of Research. In January of 2014, he was promoted to Associate Director of Research where he was responsible to lead different groups of analysts and strategists within the broader Research team at WisdomTree. In February of 2018, Christopher was promoted to Head of Research, Europe, where he was based out of WisdomTree’s London office and was responsible for the full WisdomTree research effort within the European market, as well as supporting the UCITs platform globally. In November 2021, Christopher was promoted to Global Head of Research, now responsible for numerous communications on investment strategy globally, particularly in the thematic equity space. Christopher came to WisdomTree from Lord Abbett, where he worked for four and a half years as a Regional Consultant. He received his MBA in Quantitative Finance, Accounting, and Economics from NYU’s Stern School of Business in 2010, and he received his bachelor’s degree from Colgate University in Economics in 2006. Christopher is a holder of the Chartered Financial Analyst Designation.