
WTV
U.S. Value Fund

Published December 6, 2024

Global Head of Research
How do you beat the market?1 For many investors, this is among the first questions that leap to mind and a motivating reason that attracts them to the craft of investing.
However, it is one of the most challenging endeavors in business.
A critical first step in attempting to beat the market is deciding how to be different than the market. Each difference can create risk—that risk can drive either underperformance or outperformance.
A classic strategy, far easier said than done, is to simply “buy undervalued stocks.” The deceptive aspect is that there has not yet been a single way discovered to value businesses that gets to the correct place all of the time. We instead have a plethora of valuation metrics, some of which tend to add different levels of value in different market environments.
WisdomTree U.S. Value Fund (WTV): The strategy seeks income and capital appreciation by investing primarily in U.S. equity securities that provide a high total shareholder yield with favorable relative quality characteristics. For the purposes of looking at a performance benchmark, we can compare WTV to the Russell 1000 Value Index.
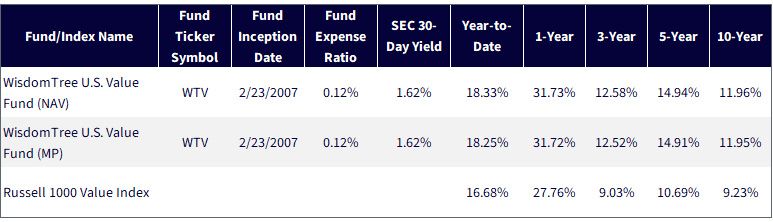
Source: WisdomTree, as of 9/30/24. NAV denotes total return performance at net asset value. MP denotes market price performance. In the case of WTV, the Fund’s objective changed effective 12/18/17. Prior to 12/18/17, Fund performance reflects the investment objective of the Fund when it tracked the performance, before fees and expenses, of the WisdomTree U.S. LargeCap Value Index. Past performance is not indicative of future results. Investment return and principal value of an investment will fluctuate so that an investor’s shares, when redeemed, may be worth more or less than their original cost. Current performance may be lower or higher than the performance data quoted. For the most recent month-end and standardized performances, click here.
Focusing on total shareholder yield has been gaining prominence, but in the realm of “value strategies,” it is still nowhere as close in popularity as the longstanding “book-to-market” ratio.2 Therefore, WTV first must prove a capability to outperform a value benchmark to showcase the potential efficacy of defining value this way.
Looking at figure 2, measuring as of November 22, 2024, we can see:
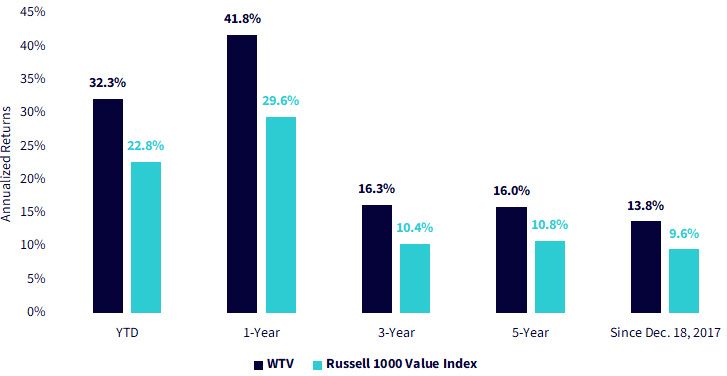
Source: WisdomTree, as of 11/30/24. Returns shown at NAV. In the case of WTV, the Fund’s objective changed effective 12/18/17. Prior to 12/18/17, Fund performance reflects the investment objective of the Fund when it tracked the performance, before fees and expenses, of the WisdomTree U.S. LargeCap Value Index. Past performance is not indicative of future results. Investment return and principal value of an investment will fluctuate so that an investor’s shares, when redeemed, may be worth more or less than their original cost. Current performance may be lower or higher than the performance data quoted. For the most recent month-end and standardized performances, click here.
Sector exposures get a lot of attention against benchmarks because they feel very intuitive and are easy to measure. Investors appreciate outperformance that is generated without being dramatically different across too many sectors since this is seen as “less risky.”
In figure 3, we examine the sector similarities and differences:
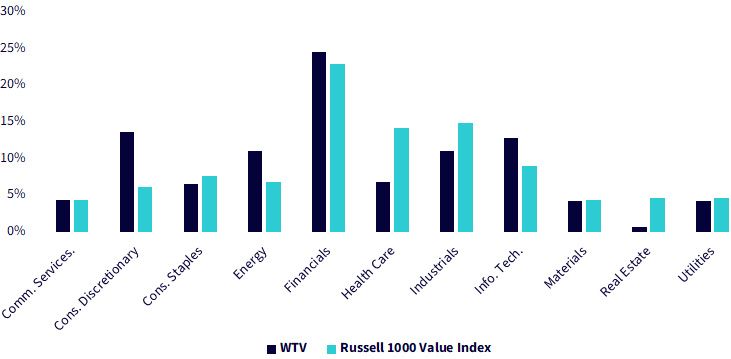
Source: WisdomTree, through the Fund Comparison Tool within the PATH suite of tools. Data is as of 11/30/24. Weightings are subject to change. You cannot directly invest in an index.
Focusing on shareholder yield to define which companies look value-oriented is our “different ingredient.” While other value strategies may incorporate attentiveness to dividends and buybacks, WTV's approach has this as the primary manner of defining which companies tick the right boxes to be considered “value.”
Figure 4 makes this very clear:
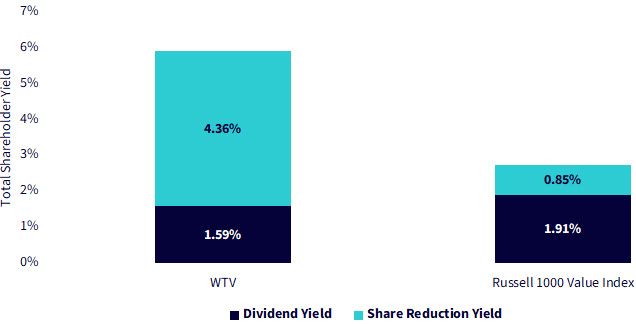
Source: WisdomTree, through the Fund Comparison Tool within the PATH suite of tools. Data is as of 10/31/24. Past performance is not indicative of future results. You cannot directly invest in an index.
It is quite difficult to prove unequivocally that a particular metric has no value for investors. Far more often, what we see is just an ever-expanding list of ways that one can define different factors—and sometimes, we even see an ever-expanding list of factors!4
In figure 5, we sought to test WTV on some of the more traditional measures of value. Remember, the Russell 1000 Value Index is directly focused on three things: a measure of value relative to book value, earnings and sales.
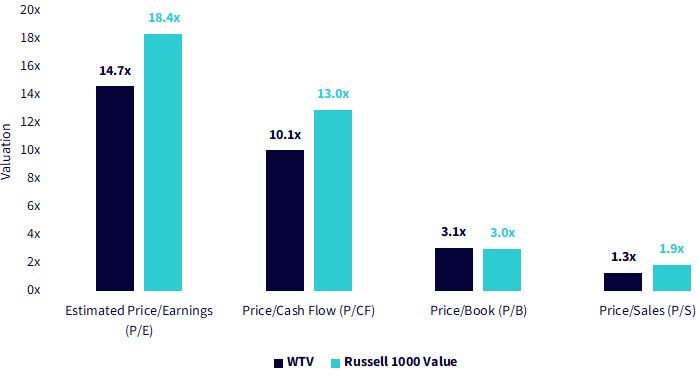
Source: WisdomTree, FactSet, as of 11/31/24. For definitions of terms in the chart above, please visit the glossary.
Though we compare WTV to a large cap value benchmark in the analysis above, it is placed within the U.S. Mid-Cap Value category under Morningstar’s methodology. Figure 6 indicates some of the details about this peer group, where there are many, many other managers issuing both ETFs and mutual funds.
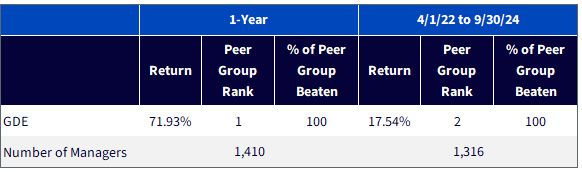
Source: Morningstar Direct, as of 11/30/24. Returns shown at NAV. U.S. Fund Mid Value. Morningstar, Inc. All rights reserved. The information contained herein: (1) is proprietary to Morningstar and/or its content providers; (2) may not be copied or distributed; and (3) is not warranted to be accurate, complete or timely. Neither Morningstar nor its content providers are responsible for any damages or losses arising from any use of this information. Past performance, rankings and ratings are no guarantee of future results. Regarding ranking of funds, 1=Best. Morningstar rankings are based on a fund’s average annual total return relative to all funds in the same Morningstar category. Fund performance used within the rankings reflects certain fee waivers, without which returns and Morningstar rankings would have been lower. The highest (or most favorable) percentile rank is 1, and the lowest (or least favorable) percentile rank is 100. Past performance is not indicative of future results.
While we know there are never any guarantees that such strong rankings can be maintained, we believe that total shareholder yield as a measure of value is making a strong case to become a more mainstream “value factor” within U.S. equities.
1 Market typically refers to broad, benchmark indexes across large-, mid- and small-cap stocks, such as the Russell 3000 Index.
2 The book-to-market ratio was referenced in Eugene Fama & Kenneth French’s “The Cross-Section of Expected Stock Returns,” first published in 1992 within the Journal of Finance.
3 Source: Emily Bary, “AppLovin’s stock easily seals its best week ever. It’s now up 600% this year,” MarketWatch, 11/8/24.
4 Source: Campbell R. Harvey & Yan Liu, “A Census of the Factor Zoo,” SSRN, 2019. This paper referenced more than 400 different factors.
For current holdings, please click here. Holdings are subject to risk and change.
There are risks associated with investing, including possible loss of principal. Funds focusing their investments on certain sectors increase their vulnerability to any single economic or regulatory development. This may result in greater share price volatility. While the Fund is actively managed, the Fund’s investment process is expected to be heavily dependent on quantitative models and the models may not perform as intended. Please read the Fund’s prospectus for specific details regarding the Fund’s risk profile.
U.S. Value Fund

Global Head of Research
Christopher Gannatti began at WisdomTree as a Research Analyst in December 2010, working directly with Jeremy Schwartz, CFA®, Director of Research. In January of 2014, he was promoted to Associate Director of Research where he was responsible to lead different groups of analysts and strategists within the broader Research team at WisdomTree. In February of 2018, Christopher was promoted to Head of Research, Europe, where he was based out of WisdomTree’s London office and was responsible for the full WisdomTree research effort within the European market, as well as supporting the UCITs platform globally. In November 2021, Christopher was promoted to Global Head of Research, now responsible for numerous communications on investment strategy globally, particularly in the thematic equity space. Christopher came to WisdomTree from Lord Abbett, where he worked for four and a half years as a Regional Consultant. He received his MBA in Quantitative Finance, Accounting, and Economics from NYU’s Stern School of Business in 2010, and he received his bachelor’s degree from Colgate University in Economics in 2006. Christopher is a holder of the Chartered Financial Analyst Designation.


