
DGRW
U.S. Quality Dividend Growth Fund

Published August 15, 2024

Global Chief Investment Officer

Global Head of Research
Equity market corrections always feel unexpected. As we sit here in August 2024, we have seen (Figure 1) the VIX1 increase from a level of about 12 at the beginning of July 2024 to a near-term peak as of this writing, based on closing prices, of 38.57.2
Our Senior Economist Jeremy Siegel believes that the Fed should get to a more neutral policy stance with the Fed Funds interest rate as soon as possible, due to recent data points on inflation and unemployment.3
Rates are generally coming down, and the professor believes this could be a very good setup for dividend-paying and more defensive stocks.
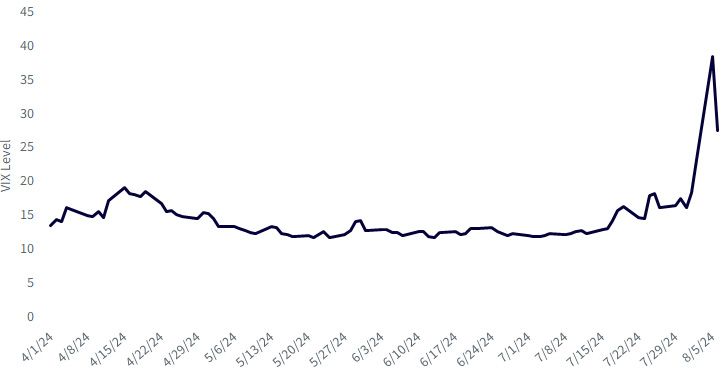
Source: Chicago Board Options Exchange, CBOE Volatility Index: VIX [VIXCLS], retrieved from FRED, Federal Reserve Bank of St. Louis;
https://fred.stlouisfed.org/series/VIXCLS. Data for the period 8/7/23–8/6/24. Past performance is not indicative of future results.
WisdomTree has been managing dividend-focused equity strategies since June 2006—a period that is now approaching 20 years. Consider these notable trends:
The beginning of August 2024 is giving us at least initial indications that a market correction could be in store. Because the Magnificent 7 and the growth style have received so much attention in the past 20 or so months, we wanted to remind investors where to look for more defensive equity orientations.
All dividend-paying firms are not equal. On one end of the spectrum, think about a Utility firm. Utilities are a regulated industry, and these companies can operate only in a highly specified and expected manner. With this low expected growth of fundamentals such as sales, cash flows and earnings, there is a lower current valuation. Another way to think about this is a higher dividend yield. On the other end of the spectrum, think about a Communication Services or Information Technology company. Meta Platforms declared a dividend in 2024,6 and it is a good, concrete example. This firm may deliver strong growth in sales, cash flows and earnings, and its potential for strong growth leads to a higher valuation—and a lower dividend yield.
These differences become important when there is a shift from a bull market to a correction and then to a bear market.
At WisdomTree, the dividend continuum in U.S. equities is apparent across three strategies:
Now, we know the dividend continuum, and we know that the beginning of August 2024 has been a tougher equity performance month. Is the actual performance playing out the way we might predict using this paradigm?
To access each fund's prospectus please click the respective ticker: DHS, DLN, DGRW.
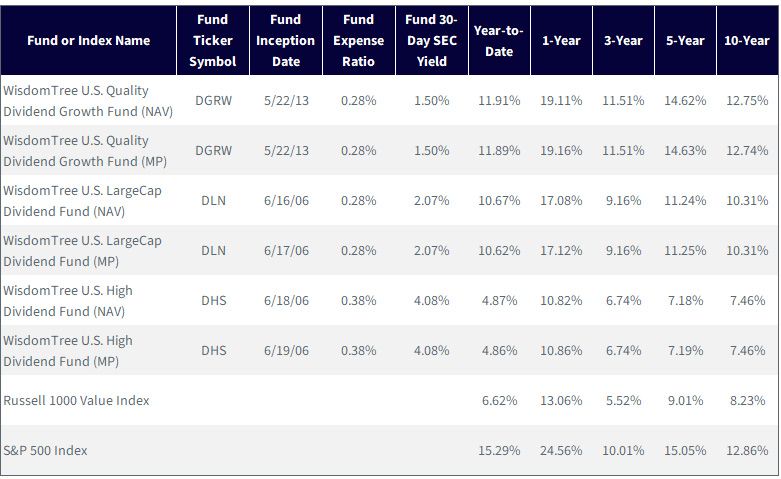
Sources: WisdomTree, S&P, Bloomberg, as of 6/30/24. Performance of less than one year is cumulative. You cannot directly invest in an index.
Performance is historical and does not guarantee future results. Current performance may be lower or higher than quoted. Investment
returns and principal value of an investment will fluctuate so that an investor’s shares, when redeemed, may be worth more or less
than their original cost. For the most recent month-end performance, click the relevant ticker: DGRW, DLN and DHS. WisdomTree shares
are bought and sold at market price (not NAV) and are not individually redeemed from the Fund. Total returns are calculated using the daily 4:00 p.m.
EST net asset value (NAV). Market price returns reflect the midpoint of the bid/ask spread as of the close of trading on the exchange where Fund
shares are listed. Market price returns do not represent the returns you would receive if you traded shares at other times.
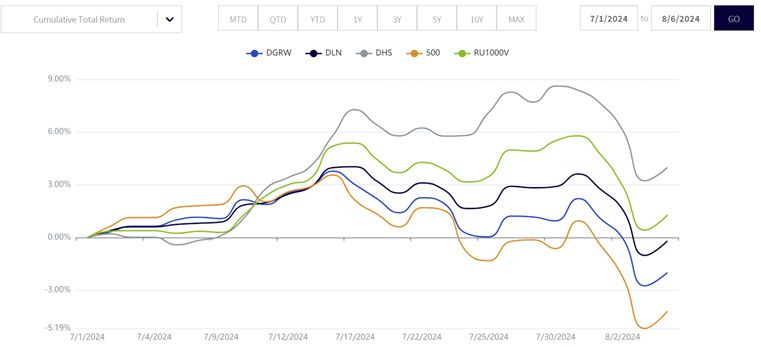
Source: WisdomTree, specifically data from the Fund Comparison Tool in the PATH suite of tools, for the period 7/1/24–8/6/24. Fund
performance is shown at net asset value. Performance is historical and does not guarantee future results. Current performance may be
lower or higher than quoted. Investment returns and principal value of an investment will fluctuate so that an investor’s shares,
when redeemed, may be worth more or less than their original cost. For the most recent month-end performance, click the relevant
ticker: DGRW, DLN and DHS.
If we look year-to-date, we can recognize that, yes, the start of August 2024 has been a tougher month, but most of 2024 leading up to early August was pretty good.
By going down less in comparison to the S&P 500 Index, DGRW and DLN in particular made up significant ground, performance-wise.
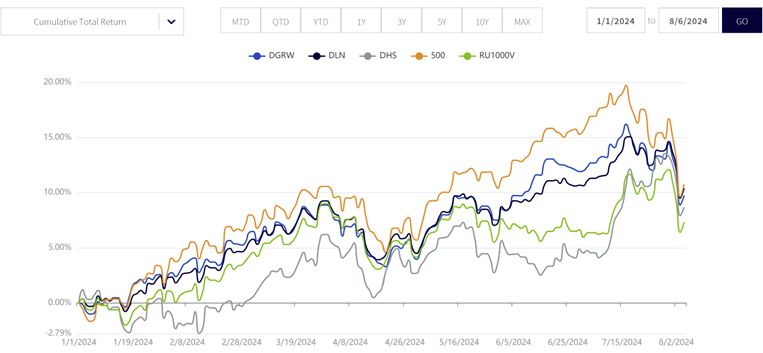
Source: WisdomTree, specifically data from the Fund Comparison Tool in the PATH suite of tools, for the period 7/1/24–8/6/24. Fund performance
is shown at net asset value. Performance is historical and does not guarantee future results. Current performance may be lower or
higher than quoted. Investment returns and principal value of an investment will fluctuate so that an investor’s shares, when
redeemed, may be worth more or less than their original cost. For the most recent month-end performance, click the relevant ticker:
DGRW, DLN and DHS.
If there is a longer-lasting sector rotation, the sector composition of various dividend strategies that could help implement a more defensive posture is as follows:
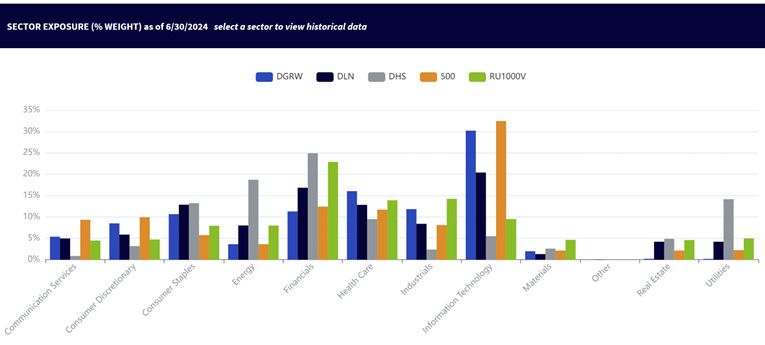
Source: WisdomTree, specifically data from the Fund Comparison Tool in the PATH suite of tools, as of 6/30/24. Holdings are subject to change.
With indexes, you can get a sense of historically consistent attributes of a given strategy and methodology.
DHS tracks an Index that annually resets to the 30% highest-yielding dividend payers.
In Figure 5, we see the significant dividend-yield advantage measured across time—a significant period.
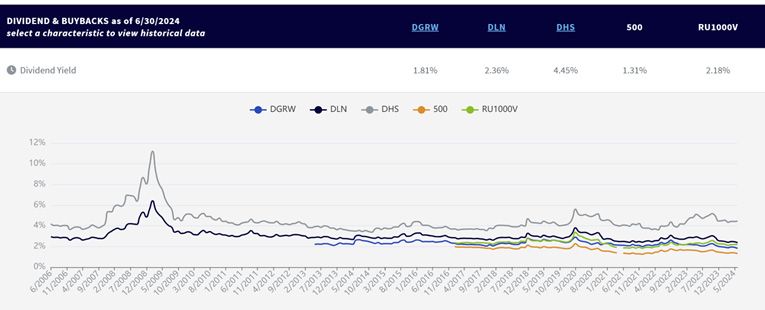
Source: WisdomTree, specifically data from the Fund Comparison Tool in the PATH suite of tools, from 6/06 to 6/24. The 30-day SEC yield for the
relevant funds is shown in Figure 2a. 500 refers to the S&P 500 Index. RU1000V refers to the Russell 1000 Value Index. Past performance is not
indicative of future results.
2022 was a year when dividend and value strategies stood out as the Technology sector hit a downturn. 2023 brought AI and tech leadership back in force once again, and much of the start of 2024 continued with that environment. August serves as a reminder that defensive strategies often focus on dividends, and there are many good implementation ideas, depending on your conviction of the rotation.
1 Refers to the CBOE Volatility Index.
2 Source: Chicago Board Options Exchange, CBOE Volatility Index: VIX [VIXCLS], retrieved from FRED, Federal Reserve Bank of St. Louis; https://fred.stlouisfed.org/series/VIXCLS.
3 Source: Siegel, Jeremy, “Calm Markets Amid Fed Uncertainty,” WisdomTree, 8/12/24.
4 The term Magnificent 7 gained prominence in 2023 and refers to Microsoft, Apple, Amazon.com, Alphabet, Meta Platforms, Nvidia and Tesla.
5 Sources: WisdomTree, FactSet, with data as of 4/19/24.
6 Source: Press release: “Meta Reports Fourth Quarter and Full Year 2023 Results; Initiates Quarterly Dividend,” 2/1/24.
There are risks associated with investing, including possible loss of principal. Funds focusing their investments on certain sectors may be more vulnerable to any single economic or regulatory development. This may result in greater share price volatility. Dividends are not guaranteed, and a company currently paying dividends may cease paying dividends at any time. Please read the Fund’s prospectus for specific details regarding the Fund’s risk profile.

Global Chief Investment Officer
Jeremy Schwartz has served as Global Chief Investment Officer since November 2021 and leads WisdomTree’s investment strategy team in the construction of WisdomTree’s equity Indexes, quantitative active strategies and multi-asset Model Portfolios. Jeremy joined WisdomTree in May 2005 as a Senior Analyst, adding Deputy Director of Research to his responsibilities in February 2007. He served as Director of Research from October 2008 to October 2018 and as Global Head of Research from November 2018 to November 2021. Before joining WisdomTree, he was a head research assistant for Professor Jeremy Siegel and, in 2022, became his co-author on the sixth edition of the book Stocks for the Long Run. Jeremy is also co-author of the Financial Analysts Journal paper “What Happened to the Original Stocks in the S&P 500?” He received his B.S. in economics from The Wharton School of the University of Pennsylvania and hosts the Behind the Markets podcast. Jeremy is a member of the CFA Society of Philadelphia.

Global Head of Research
Christopher Gannatti began at WisdomTree as a Research Analyst in December 2010, working directly with Jeremy Schwartz, CFA®, Director of Research. In January of 2014, he was promoted to Associate Director of Research where he was responsible to lead different groups of analysts and strategists within the broader Research team at WisdomTree. In February of 2018, Christopher was promoted to Head of Research, Europe, where he was based out of WisdomTree’s London office and was responsible for the full WisdomTree research effort within the European market, as well as supporting the UCITs platform globally. In November 2021, Christopher was promoted to Global Head of Research, now responsible for numerous communications on investment strategy globally, particularly in the thematic equity space. Christopher came to WisdomTree from Lord Abbett, where he worked for four and a half years as a Regional Consultant. He received his MBA in Quantitative Finance, Accounting, and Economics from NYU’s Stern School of Business in 2010, and he received his bachelor’s degree from Colgate University in Economics in 2006. Christopher is a holder of the Chartered Financial Analyst Designation.
