
WTBN
Bianco Total Return Fund

Published October 10, 2024

Global Chief Investment Officer

President and Macro Strategist, Bianco Research, L.L.C
As the year hits the three-quarter pole, the Bianco Research Fixed Income Total Return Index (BTRINDX) has returned 5.27%, or 58 basis points (bps) better than the Bloomberg US Aggregate Index’s total return of 4.69%. The Bloomberg US Aggregate Index has returned 4.06%, or 121 bps less than BTRINDX.
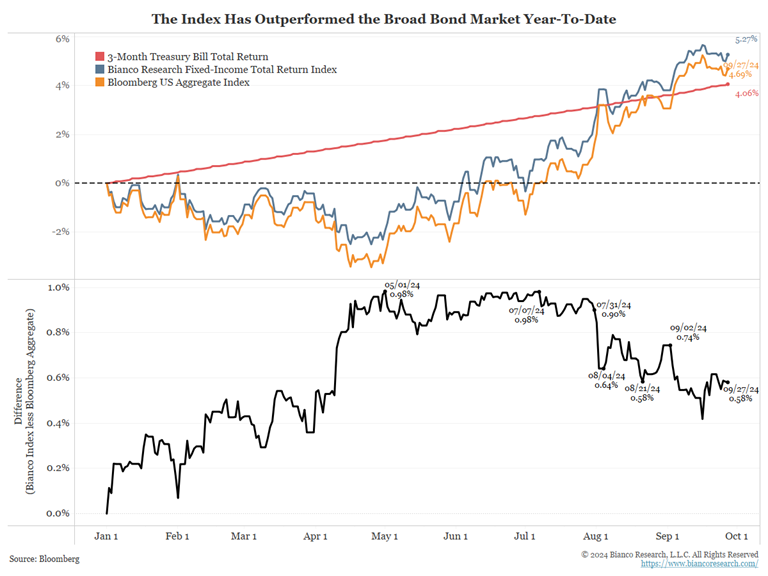
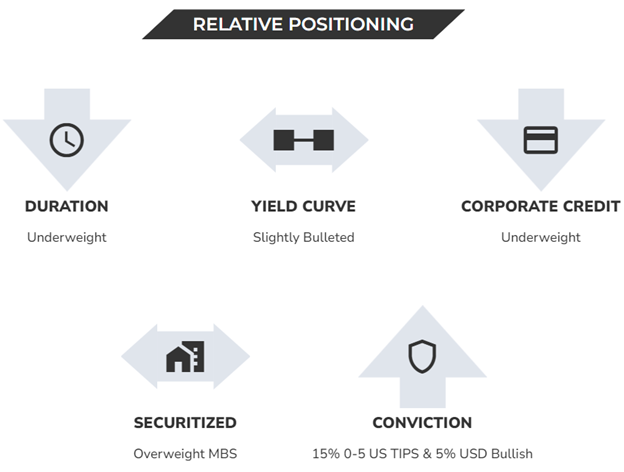
The primary factors driving performance during the three quarters of 2024 were the relative under-weight in duration versus our benchmark index through the end of April, an out-of-index position of as much as 20% in short-duration Treasury Inflation-Protected Securities (TIPS), and a long U.S. dollar position of 5%.
This positioning served performance well until the end of July (see the first chart above). Since then, however, the under-weight in duration has dragged on relative performance.
As we detailed in the Q1 Investor Letter titled Observable Yields,1managing a bond fund in 2024 or including bonds within a broader portfolio now that bonds again have a yield, is far different from the old “60/40” portfolio mix days when low-yielding bonds were effectively stock market crash insurance.
We also detailed this in a May opinion piece in The Financial Times:
Jeremy Siegel, author of Stocks for the Long Run, updated his book last year with Jeremy Schwartz, the global chief investment officer of WisdomTree. The book suggests that the annualised long-run returns for the major asset classes are 8 per cent for stocks, 5 per cent for bonds, 4 per cent for Treasury Bills, and 2 per cent for gold.
Without ever-falling bond yields, the modern total return manager’s job is to protect the income stream from their investments in downturns and augment it in upswings. Quite simply, their job is to do better than so-called coupon clipping — just taking the yield.
Even just looking at current coupon levels, fixed-income total return investing, if done correctly, offers at least two-thirds of the stock market’s 8 per cent potential with far less volatility.2
If the Fed cuts rates near 3%, historical yield curve spreads imply a 2-Year yield near 3.60%, its current level. Ten-Year yields would project near 4.60%, 85 bps higher than their current level.
The Fed started easing. How fast and deep is the market projecting future rate cuts?
The blue line below shows what the Fed has communicated. Since the Fed only offers year-end forecasts, Bianco Research estimated the pace in between. The orange line is the forward Fed Funds Futures curve. This is what the market is pricing in. The Fed expects to lower the funds rate by 200 bps through the end of 2025. The market expects the funds rate to be reduced by 250 bps over the next 15 months.
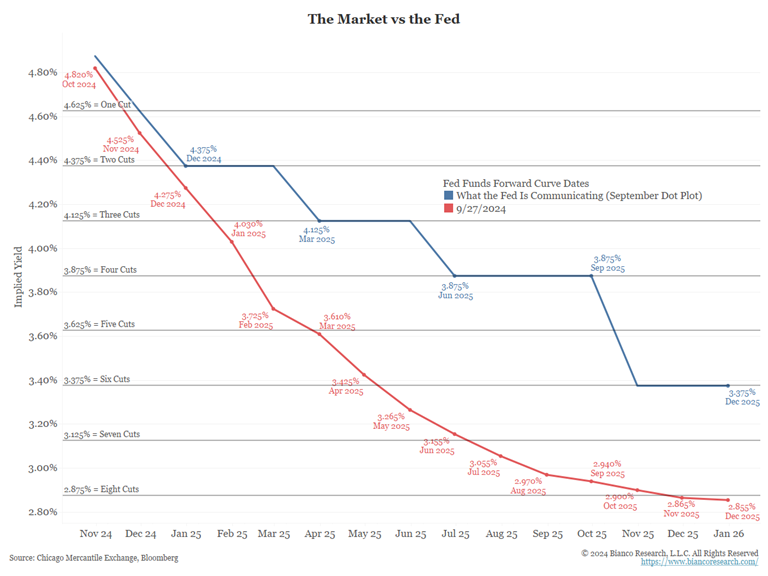
While it is debatable whether the Fed will cut this much, let's assume the funds rate is in the low 3% range at the end of next year. Given this, where should the rest of the yield curve trade if this funds rate is achieved?
The chart below shows the 2-Year yield (blue), the Fed Funds rate (orange) and the spread between the two in the bottom panel. The average spread and its standard deviation are also highlighted in the bottom panel.
The average 2-Year less Fed Funds spread is 42 bps. This average is consistent with many economic cycles. Highlighted in black (bottom panel) is the spread during the post-financial crisis period. Its average was also close to 42 bps.
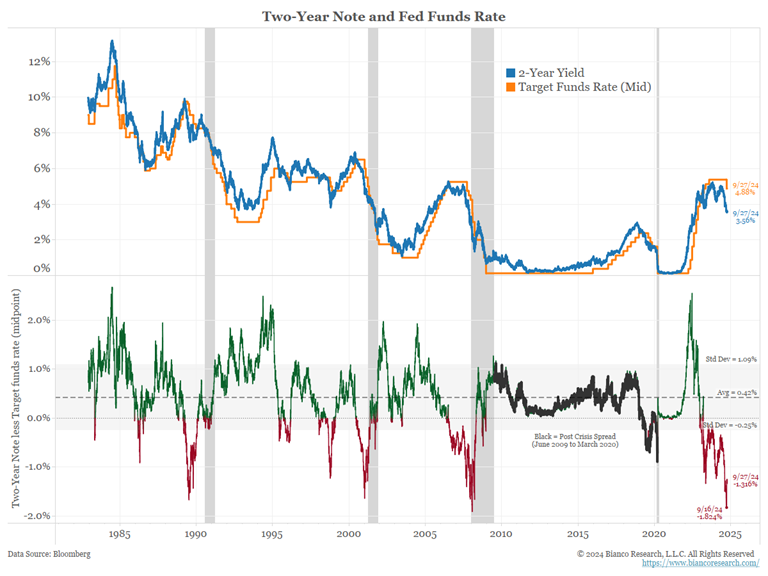
So, if the Fed Funds Rate approaches 3.125% by the end of next year, roughly the midpoint between Fed and market forecasts, where should the 2-Year note trade?
The 2-Year yield is 3.56%, less than two bps from this level. In other words, the 2-Year note has already discounted this entire rate-cut cycle.
If the 2-Year yield settles near 3.60%, where should the 10-Year yield trade?
The next chart shows the 2-Year yield (blue), the 10-Year yield (orange) and the 10-Year less 2-Year spread in the bottom panel. The post-financial crisis period is detailed in black.
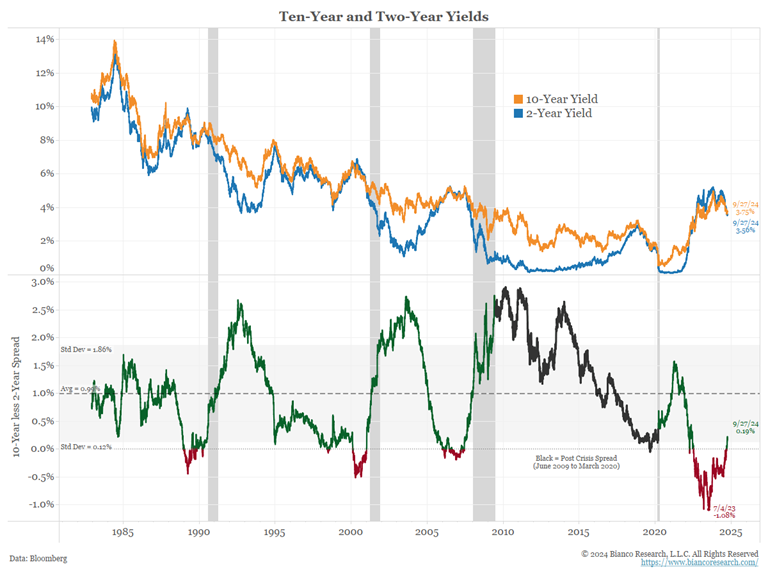
The average 10-Year less 2-Year spread is 100 bps. Like the 2-Year/Fed Funds Rate spread, this average holds throughout most cycles, including the post-financial crisis period.
So, if the 2-Year will trade at 3.60% by the end of next year, and the 10-Year less 2-Year spread returns to its average, where should the 10-Year note trade?
As we write, the 10-Year yield is 3.75%, about 85 bps below this level. In other words, the 10-Year note is way below the level that would be implied by historical spreads.
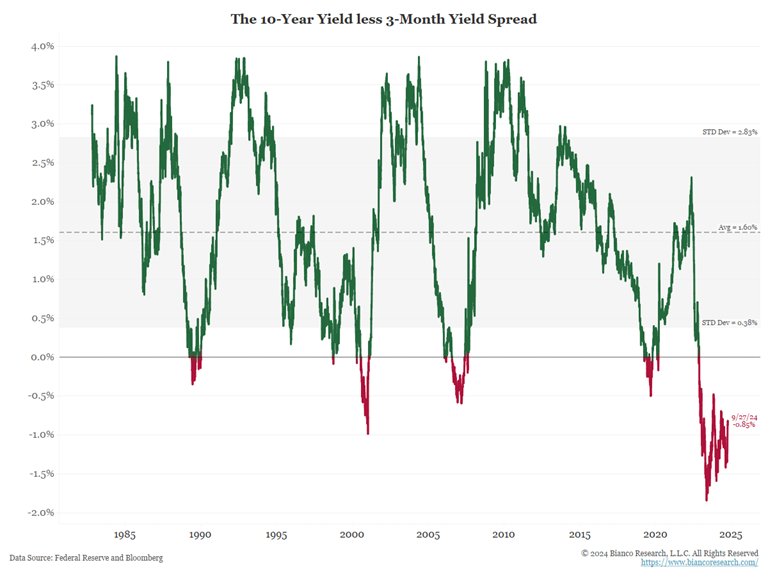
The final yield curve chart below shows a 10-Year less 3-month spread. This is the yield curve that most economists focus on.
Its average spread is 1.60%. So, if the funds rate is lowered to 3% and 3-month yields follow suit, this again projects a 10-Year yield somewhere near 4.6% if the curve returns to normal.
Recently, Chicago Federal Reserve President Austan Goolsbee said the neutral funds rate is hundreds of basis points below the current level. How does he arrive at this level?
He argues the Fed has returned the long-run inflation rate to 2% and that actual rates are too high. What is the appropriate level of real rates?
The next chart shows the Fed’s favorite measure of real rates, the Fed Funds Rate less core PCE. It is divided into two regimes: the pre-QE period (blue) and the QE period (red).
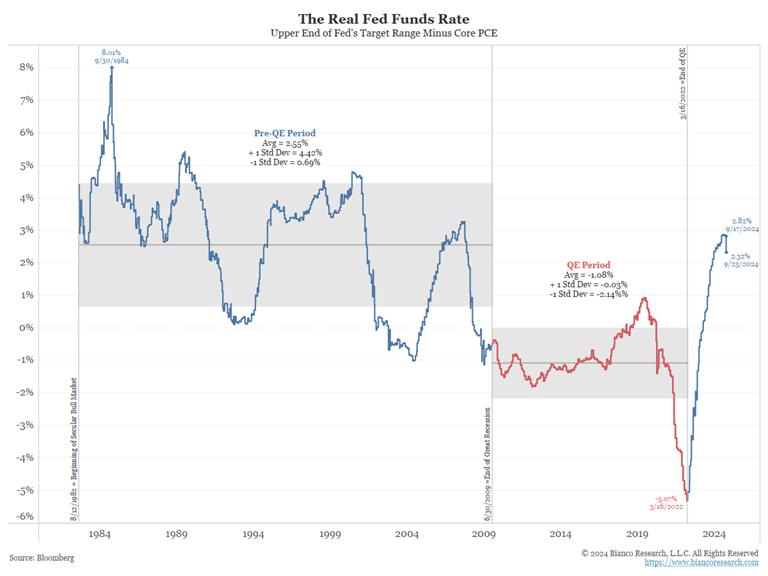
Unlike the yield curve spreads above, the QE period greatly impacted this real rate measure. When the Fed was not conducting QE (blue), this spread averaged 2.55%. When conducting QE (red), it averaged -1.08%.
Goolsbee and others argue that real rates are at 15- to 20-year highs, meaning they are highly restrictive. This is why they argue the rates must come down by hundreds of basis points.
The problem with this reasoning is that it assumes the QE period (red) does not matter. We argue it does matter, and since the Fed is no longer doing QE, real rates should approximate a pre-QE average of 2.55%. The current level of real rates, now at 2.32%, is near this level.
In our analysis above, we assume the funds rate will drop into the low 3% range as implied by the markets and Fed. This chart suggests it might not even get this low.
1 https://www.biancoadvisors.com/q1-2024-commentary-observable-yields/
2 https://www.ft.com/content/ee700f6d-57f9-4493-872f-674d4f4fe7b0
3 https://www.bloomberg.com/news/articles/2024-09-23/fed-s-goolsbee-sees-many-more-rate-cuts-over-the-next-year
This blog post was partially written by Jim Bianco on his website.
Unless otherwise stated, all charts in this blog are sourced from Bianco Research as of 9/30/24.
There are risks associated with investing, including the possible loss of principal. Fixed income investments are subject to interest rate risk; their value will normally decline as interest rates rise. Fixed income investments are also subject to credit risk, the risk that the issuer of a bond will fail to pay interest and principal in a timely manner, or that negative perceptions of the issuer’s ability to make such payments will cause the price of that bond to decline. While the Fund attempts to limit credit and counterparty exposure, the value of an investment in the Fund may change quickly and without warning in response to issuer or counterparty defaults and changes in the credit ratings of the Fund’s portfolio investments. The Fund invests in the securities included in, or representative of, its Index regardless of their investment merit, and the Fund does not attempt to outperform its Index or take defensive positions in declining markets. Please read the Fund’s prospectus for specific details regarding the Fund’s risk profile.
Bianco Total Return Fund

Global Chief Investment Officer
Jeremy Schwartz has served as Global Chief Investment Officer since November 2021 and leads WisdomTree’s investment strategy team in the construction of WisdomTree’s equity Indexes, quantitative active strategies and multi-asset Model Portfolios. Jeremy joined WisdomTree in May 2005 as a Senior Analyst, adding Deputy Director of Research to his responsibilities in February 2007. He served as Director of Research from October 2008 to October 2018 and as Global Head of Research from November 2018 to November 2021. Before joining WisdomTree, he was a head research assistant for Professor Jeremy Siegel and, in 2022, became his co-author on the sixth edition of the book Stocks for the Long Run. Jeremy is also co-author of the Financial Analysts Journal paper “What Happened to the Original Stocks in the S&P 500?” He received his B.S. in economics from The Wharton School of the University of Pennsylvania and hosts the Behind the Markets podcast. Jeremy is a member of the CFA Society of Philadelphia.

