
USFR
Floating Rate Treasury Fund

Published September 5, 2024

Global Chief Investment Officer

President and Macro Strategist, Bianco Research, L.L.C
Bond investors had it relatively easy over the last few years. The Fed brought short-term interest rates to 5.375% to combat inflation and this anchored yields in such a manner that one could earn healthy fixed income returns while taking on little price volatility.
At his August Jackson Hole speech, Fed Chair Jerome Powell indicated the time has come for the Fed to start lowering rates at the September meeting.1 How fast rates come down is now clearly a function of the underlying trends in the economy and employment, even more than inflation.
Is now the time to add to duration as Fed rate cuts materialize?
WisdomTree collaborated with Bianco Research, one of the leading macro and bond market research firms, to provide a dynamic index-based solution for core bond exposures.
The WisdomTree Bianco Total Return Fund (WTBN) seeks to track the price and yield performance, before fees and expenses, of the Bianco Research Fixed Income Total Return Index.
On a macro basis, Bianco believes the economy is stronger than many fear and that inflation pressures will remain stickier. This could mean the Fed cuts are shallower than many expect and that rates could face some upward pressure at the long end of the U.S. yield curve.
Being dynamic in assessing the underlying direction of yields is becoming more important at this stage in the yield cycle.
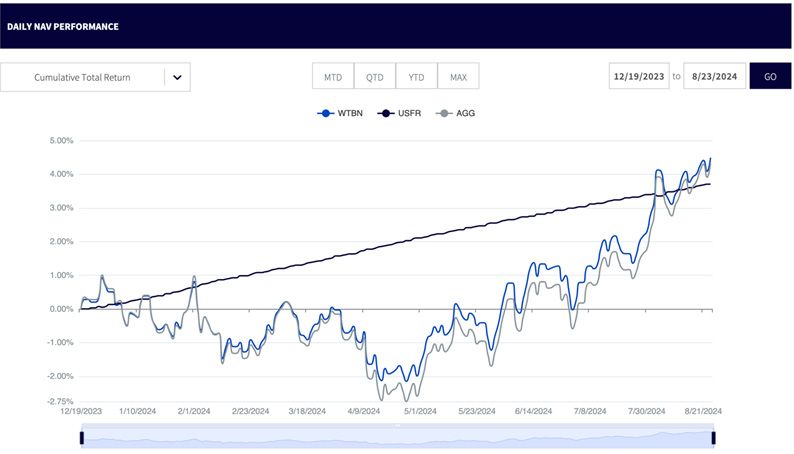
WTBN was launched at the end of 2023. In the spring of 2024, as long-term bond rates were rising, staying in short-term instruments provided cushion while taking on duration provided a drawdown.
But now as rates have come down off fears of economic weakness, a broader bond exposure has started to outperform the shortest duration instruments.
To provide appropriate context for considering WTBN's pattern of returns, we looked at:
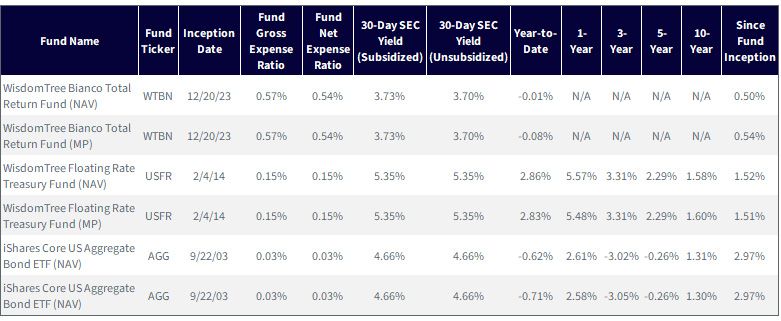
Source: WisdomTree, specifically data from the Fund Comparison Tool in the PATH suite of tools, as of 6/30/24. NAV denotes total return performance at net asset value. MP denotes market price performance. Gross expense ratio = the total annual operating expense ratio of a fund, including management fees, administrative costs, and operational expenses. Net expense ratio = the actual cost to investors after accounting for any fee waivers or reimbursements. For WTBN the Net Expense Ratio reflects a contractual waiver of 0.02% through December 31, 2025. Past performance is not indicative of future results. Investment return and principal value of an investment will fluctuate so that an investor’s shares, when redeemed, may be worth more or less than their original cost. Current performance may be lower or higher than the performance data quoted. For the most recent month-end and standardized performance and to download the respective Fund prospectuses, click the relevant ticker: WTBN, USFR, AGG.
Figure 2 provides a good look, going back to the full available history in WisdomTree’s fund comparison tool, at WTBN and shows how the other funds, USFR and AGG, compared.
Source: WisdomTree, specifically data from the Fund Comparison Tool in the PATH suite of tools, for the period 12/20/23–8/23/24. NAV denotes total return performance at net asset value. MP denotes market price performance. Past performance is not indicative of future results. Investment return and principal value of an investment will fluctuate so that an investor’s shares, when redeemed, may be worth more or less than their original cost. Current performance may be lower or higher than the performance data quoted. For the most recent month-end and
standardized performance and to download the respective Fund prospectuses, click the relevant ticker: WTBN, USFR, AGG.
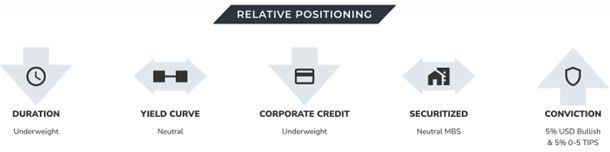
Bianco Research uses the following framework to adjust exposures in their index, typically reviewed and adjusted on a monthly basis. These components are the major return drivers of the best fixed income managers, and Bianco Research believes they can accomplish all that traditional active shops do by just allocating their index around these major buckets.
Source: Bianco Research.
Currently the index is under-weight in duration, with a 90% duration target of the broader bond market indexes.
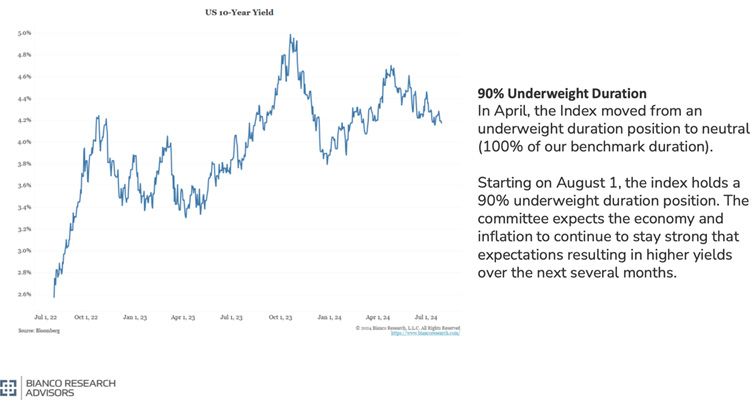
Source: Bianco Research, for the period 7/1/22–8/23/24. Figure 4 is showing the yield of the U.S. 10-Year Treasury Note. Benchmark refers to the Bloomberg U.S. Aggregate Index. Neutral relative to benchmark means essentially “the same as” that of benchmark. A 90% under-weight would mean a position 90% below that of the benchmark. Past performance is not indicative of future results.
When looking at figure 5, there is a discussion of yield curve positioning. To put it simply, the yield curve, looking from left to right can have a slope to it and this slope can shift. As it states in the text of figure 5, based on Bianco Research’s expectations for changes in this shape being what they are, a neutral positioning makes sense, in their view.
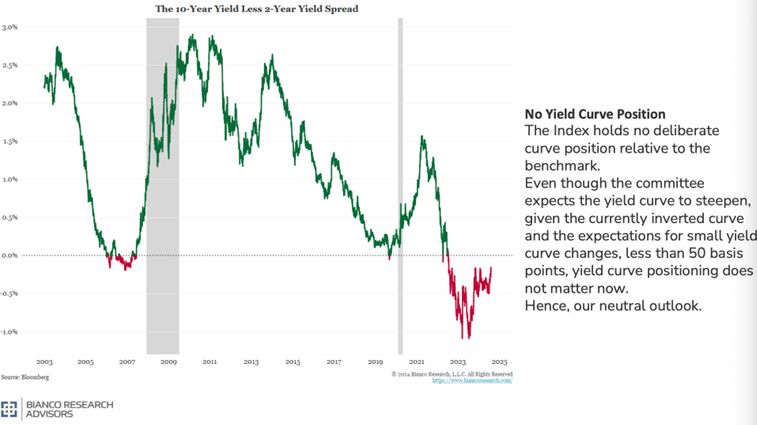
Source: Bianco Research, for the period 2003 to 8/23/24. The benchmark is the Bloomberg U.S. Aggregate Index. Figure 5 is showing the yield of the U.S. 10-Year Treasury Note minus the yield of the U.S. 2-Year Treasury Bond. The Green color indicates periods when the 10-Year yield is higher than that of the 2-Year. The red color indicates periods when the 2-Year yield is higher than that of the 10-Year. The red color could also be interpreted as periods of an inverted yield curve, when the shorter maturity issues have higher yields than the longer maturity issues. Basis points refer to 1/100th of 1 percent, shown as 0.01% for 1 basis point. Past performance is not indicative of future results.
Figure 6 illustrates that reasoning behind Bianco Research’s under-weight allocation to corporate credit. As stated in the figure, there has been record corporate bond issuance and, in their view, the equity market is overbought. This is telling us that they believe the risks in corporate credit are high relative to the possible expected returns based on current prices.
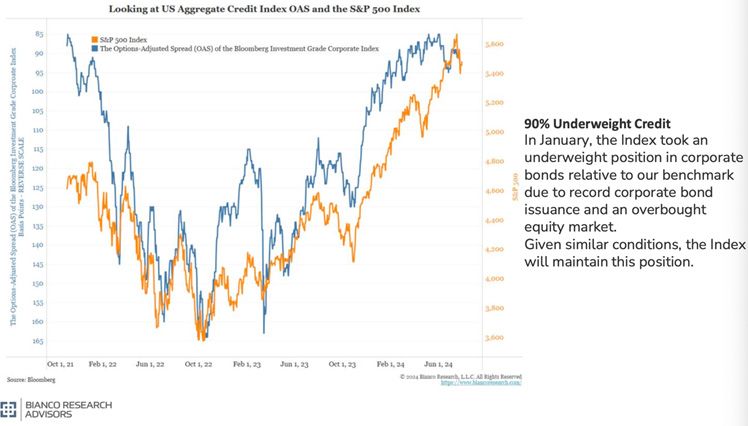
Source: Bianco Research, for the period 10/1/21–8/23/24. The benchmark is the Bloomberg U.S. Aggregate Index. The S&P 500 Index represents U.S. equities. The Options-Adjusted Spread (OAS) of the Bloomberg Investment Grade Corporate Index represents a measure of how the credit risk of the Bloomberg Investment Grade Corporate Index is being priced, with a higher spread indicating a greater potential return and a lower spread indicating a lower potential return, assuming the bonds are not called and do not default during the investment horizon. Past performance is not indicative of future results.
The index has a neutral allocation to mortgages, currently split with two different allocations to the mortgage space, the rationale for which is addressed in figure 7.
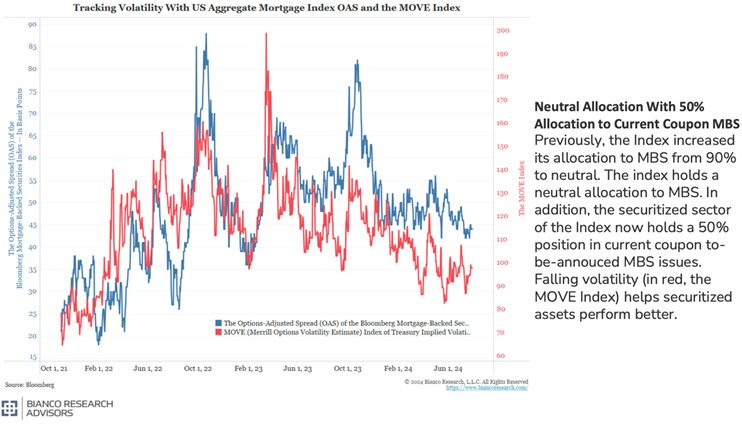
Source: Bianco Research, for the period 10/1/21–8/23/24. The current coupon mortgage-backed security is defined as the mortgage security of any issue for the current delivery month that is trading closest to, but not exceeding par value. A “to be announced” qualification means that the pool of mortgages that will back the security has not been assigned, even though the contract is about to be made. The Options- Adjusted Spread (OAS) of the Bloomberg Mortgage Backed Securities Index represents a measure of how the credit risk of the Bloomberg Mortgage Backed Securities Index is being priced, with a higher spread indicating a greater potential return and a lower spread indicating a lower potential return, assuming the bonds are not called and do not default during the investment horizon. The MOVE (Merrill Options Volatility Estimate) Index of Treasury Implied Volatility is a measure of bond market volatility.
There is a 10% ”out of benchmark” position, meaning in asset classes that are not represented within the Bloomberg U.S. Aggregate Index.
Figure 8 explains the rationale from Bianco Research for these positions.
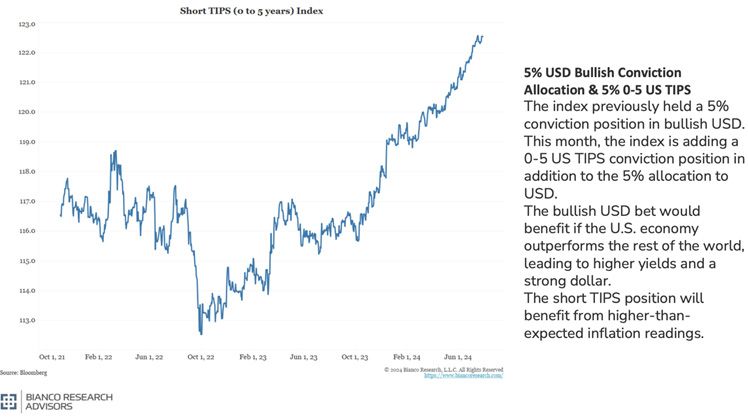
Source: Bianco Research, for the period 10/1/21–8/23/24. A bullish USD position would be an exposure that would tend to generate more positive returns if the U.S. dollar were to appreciate against a basket of other currencies. Past performance is not indicative of future results.
Bianco Research believes there is a fundamental difference between bonds and stocks with respect to market cap-weighted benchmarks.
Whereas market cap weighting rewards the big winners in equities, in bonds market capitalization weighting gives the most weight to those lower-quality issuers that need to borrow the most and take on the most debt.
This fundamental difference between what market cap weighting means for equities versus bonds is why more bond managers typically beat broad bond benchmark than in equities.
As bond market uncertainty remains high, we think now is a good time to consider a dynamic index solution like that offered by WTBN.
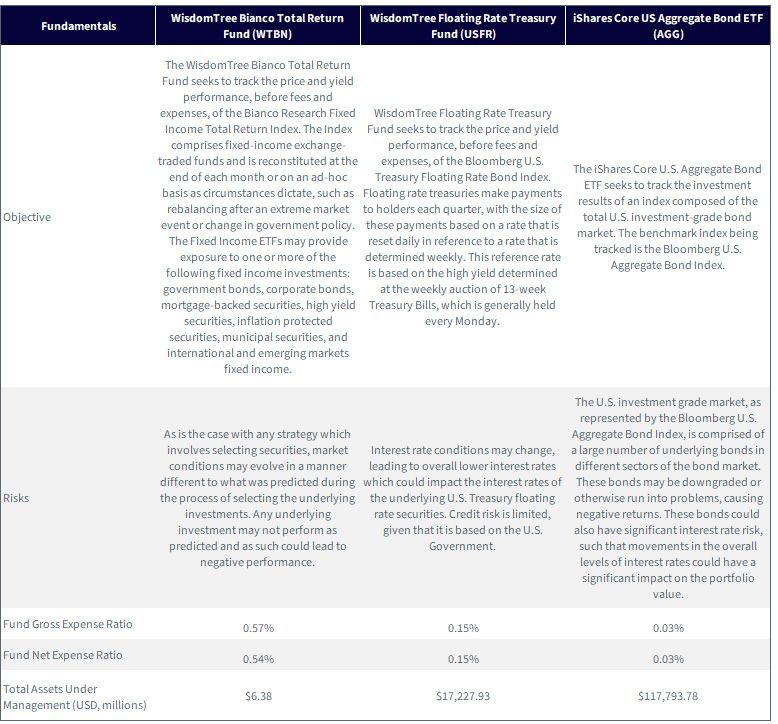
Source: WisdomTree, specifically data from the Fund Comparison Tool in the PATH suite of tools, as of 6/30/24. NAV denotes total return performance at net asset value. MP denotes market price performance. Gross expense ratio = the total annual operating expense ratio of a fund, including management fees, administrative costs, and operational expenses. Net expense ratio = the actual cost to investors after accounting for any fee waivers or reimbursements. For WTBN the Net Expense Ratio reflects a contractual waiver of 0.02% through December 31, 2025. Past performance is not indicative of future results. Investment return and principal value of an investment will fluctuate so that an investor’s shares, when redeemed, may be worth more or less than their original cost. Current performance may be lower or higher than the performance data quoted. For the most recent month-end and standardized performance and to download the respective Fund prospectuses, click the relevant ticker: WTBN, USFR, AGG.
1 Source: Jerome Powell, “Reassessing the Effectiveness and Transmission of Monetary Policy,” economic symposium, Federal Reserve Bank of Kansas City, Jackson Hole, Wyoming, 8/23/24. https://www.federalreserve.gov/newsevents/speech/powell20240823a.htm.
2 As of 8/26/24, AGG had more than $117 billion in assets under management.
There are risks associated with investing, including the possible loss of principal. Fixed income investments are subject to interest rate risk; their value will normally decline as interest rates rise. Fixed income investments are also subject to credit risk, the risk that the issuer of a bond will fail to pay interest and principal in a timely manner, or that negative perceptions of the issuer’s ability to make such payments will cause the price of that bond to decline. While the Fund attempts to limit credit and counterparty exposure, the value of an investment in the Fund may change quickly and without warning in response to issuer or counterparty defaults and changes in the credit ratings of the Fund’s portfolio investments. The Fund invests in the securities included in, or representative of, its Index regardless of their investment merit, and the Fund does not attempt to outperform its Index or take defensive positions in declining markets. Please read the Fund’s prospectus for specific details regarding the Fund’s risk profile.

Global Chief Investment Officer
Jeremy Schwartz has served as Global Chief Investment Officer since November 2021 and leads WisdomTree’s investment strategy team in the construction of WisdomTree’s equity Indexes, quantitative active strategies and multi-asset Model Portfolios. Jeremy joined WisdomTree in May 2005 as a Senior Analyst, adding Deputy Director of Research to his responsibilities in February 2007. He served as Director of Research from October 2008 to October 2018 and as Global Head of Research from November 2018 to November 2021. Before joining WisdomTree, he was a head research assistant for Professor Jeremy Siegel and, in 2022, became his co-author on the sixth edition of the book Stocks for the Long Run. Jeremy is also co-author of the Financial Analysts Journal paper “What Happened to the Original Stocks in the S&P 500?” He received his B.S. in economics from The Wharton School of the University of Pennsylvania and hosts the Behind the Markets podcast. Jeremy is a member of the CFA Society of Philadelphia.

