
WTBN
Bianco Total Return Fund

Published July 22, 2024

Global Chief Investment Officer

President and Macro Strategist, Bianco Research, L.L.C
With rates rising to levels not seen since the early 2000s, we have left behind the zero-interest rate environment that has dominated the past 15 years. We are now at the precipice of either a return to normality in the bond market with substantive yields and diversification versus equities restored or marking year four in a new bond bear market. Either way, bond managers face challenges uniquely different from those that preceded the last 15 years. This calls for new strategies that reimagine the implementation of fixed income portfolios.
In order to address these challenges, WisdomTree has collaborated with Bianco Research Advisors to take a different approach to core fixed income. Unencumbered by the biases of traditional Wall Street research, Bianco Research and its President and Market Strategist Jim Bianco have built a decades-long reputation for objective, incisive commentary that challenges consensus thinking on subjects as wide-ranging as monetary policy, the intersection of markets and politics, the role of government in the economy, fund flows and positioning in financial markets. This blog provides a mid-year market quarterly commentary from Jim Bianco.
As the year’s first half drew to a close, the Bianco Research Fixed-Income Total Return Index (Bloomberg Index Symbol: BTRINDX) finished 98 basis points (bps) better than the Bloomberg U.S. Aggregate Index.
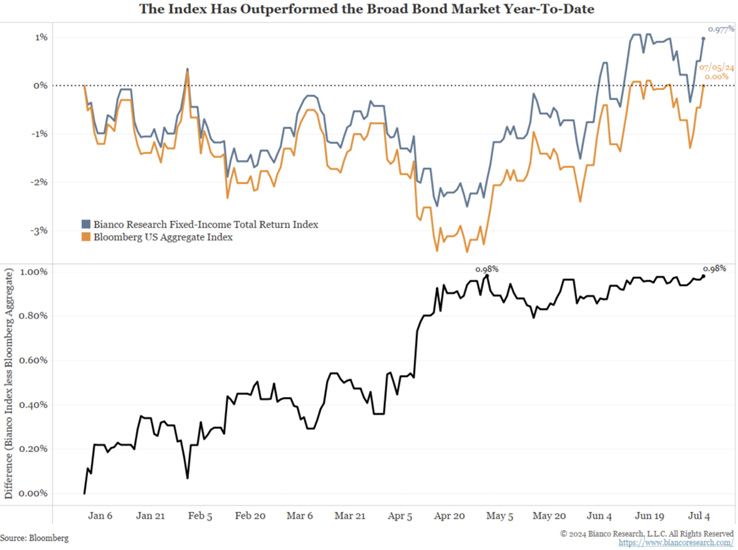
Sources: Bloomberg, Bianco Research. Past performance is not indicative of future results. You cannot invest directly in an index.
The exchange-traded fund (ETF) that tracks the performance of the Bianco Research Fixed Income Total Return Index, before fees and expenses, is the WisdomTree Bianco Total Return Fund (WTBN).
Figure 1a shows the standardized performance information of WTBN, as of June 30, 2024.
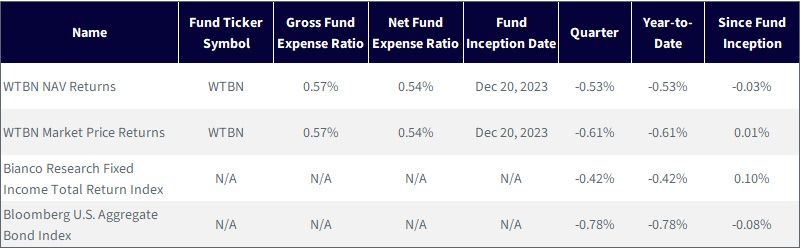
Source: WisdomTree. NAV denotes total return performance at net asset value. Market Price denotes market price performance. Past performance is
not indicative of future results. Investment return and principal value of an investment will fluctuate so that an investor’s shares, when
redeemed, may be worth more or less than their original cost. Current performance may be lower or higher than the performance data
quoted. For the most recent month-end and standardized performance and to download the respective Fund prospectuses, click here.
The expense ratio includes 0.07% of acquired fund fees and expenses (AFFEs) per annum. AFFEs are fees and expenses incurred indirectly by the Fund through its investments in certain underlying investment companies. AFFEs reflect an estimated amount for the current fiscal year and are subject to change annually. The Fund’s net expense ratio of 0.54% (the amount charged to shareholders) reflects a contractual waiver of 0.03% through December 31, 2024.
WTBN is in the Morningstar Intermediate Core-Plus Bond category. Year-to-date, its performance ranks in the second quartile and it was a first-quartile performer in Q2.1
The primary factors driving our outperformance during the first half of 2024 were the relative duration underweight versus our benchmark index, the Bloomberg U.S. Aggregate Index, through the end of April, an out-of-index position of as much as 20% in short-duration Treasury Inflation-Protected Securities (TIPS) and a relative underweight in mortgage-backed securities (MBS) through May.2
Currently, however, all our positions are neutral, with a 5% out-of-index position in the U.S. dollar. More details about our positioning can be found on our Index Update page.
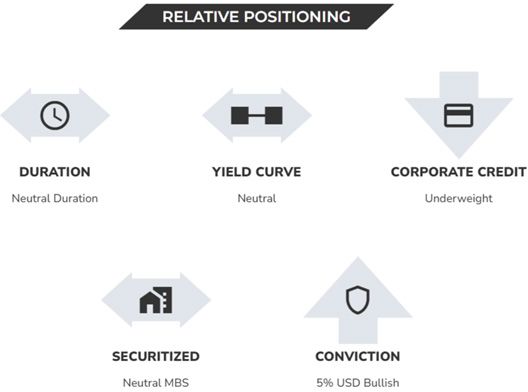
Source: Bianco Research, as of 6/30/24. Positioning is relative to the Bloomberg U.S. Aggregate Index, i.e.,
neutral duration would mean duration substantially similar to that of the benchmark. Underweight
corporate credit would mean underweight positioning relative to the benchmark. Other categories can be
interpreted analogously. Holdings subject to change.
So, why are we currently holding positions that look so similar to the benchmark?
What Is Neutral3?
Chicago Federal Reserve President Austan Goolsbee spoke recently in Sintra, Portugal (our emphasis)4:
We got to this rate when inflation was over 4%, and inflation is now down close to 2.5%, so if you sit with the rate somewhere while inflation goes down you’re tightening. The reason that you would want to tighten is if you think that you’re not on a path to 2%.
Goolsbee will vote on the Fed’s July policy decision as an alternate member of the Federal Open Market Committee.
The chief economist of Moody’s Analytics, Mark Zandi, had similar thoughts.
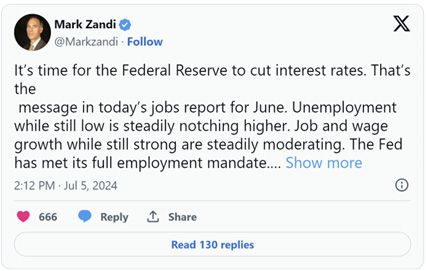
These thoughts assume some degree of certainty in regard to where the neutral interest rate is. This is the interest rate that neither stimulates nor restricts the economy. Do we know where this rate is? The Fed thinks it does.
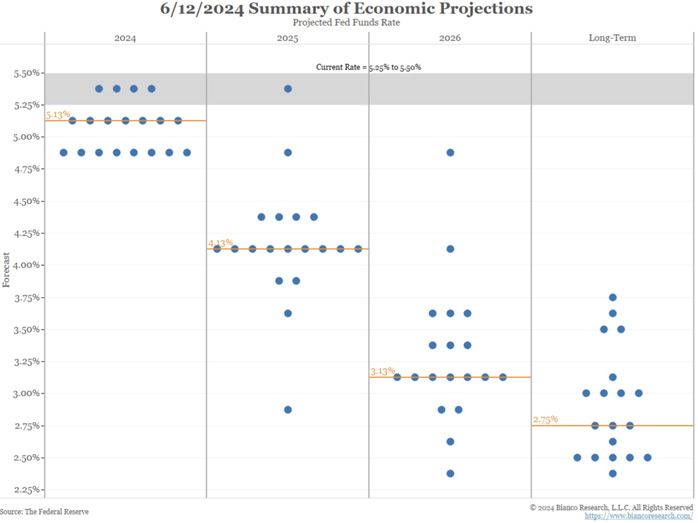
Every quarter, the Fed publishes its Summary of Economic Projections (SEP). Figure 4 shows the forecasts for the Fed Funds Rate as of the June 12 SEP. Each blue dot represents one of the 19 FOMC member’s forecasts. The orange lines show the median levels.
Sources: The Federal Reserve, Bianco Research. Subject to change.
The 2024 and 2025 medians receive most of the financial media attention. They show Fed officials expect a 25-bps rate cut in 2024 and four more 25-bps cuts in 2025.
However, we would argue the long-term dots and their median are now the most important part of this forecast. This is the Fed’s estimate of the neutral rate.
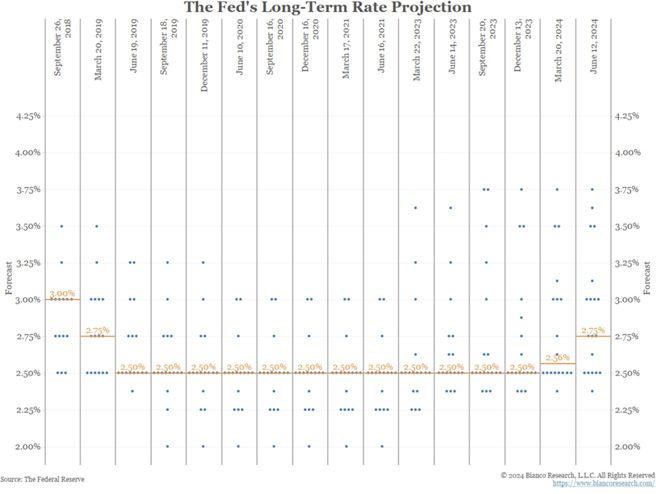
Figure 5 shows the FOMC’s long-term projections back to 2019.
Sources: The Federal Reserve, Bianco Research.
The median (orange line above) long-term rate was 2.5% for years. So, it was understandable that this rate never received attention. It was always the same. But now it is slowly starting to move higher.
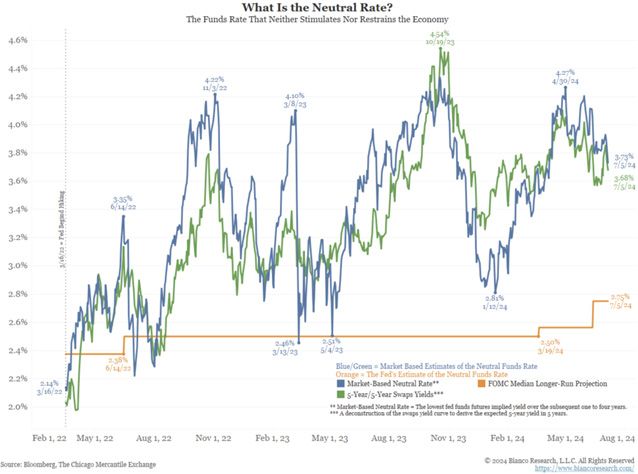
The market also has a view about the neutral rate. The next chart, figure 6, starts on March 16, 2022, when the Fed started hiking rates during the most recent cycle.
Figure 6: What Is the Neutral Rate?
Sources: Bloomberg, the Chicago Mercantile Exchange, Bianco Research, for the period 3/16/22–5/7/24. Past performance
is not indicative of future results.
Currently, the two market metrics of the neutral interest rate (blue and green) are relatively close at roughly 3.70%. Just two months ago, these metrics were near 4.25%. This is well above the Fed’s estimate of neutral at 2.75% (orange).
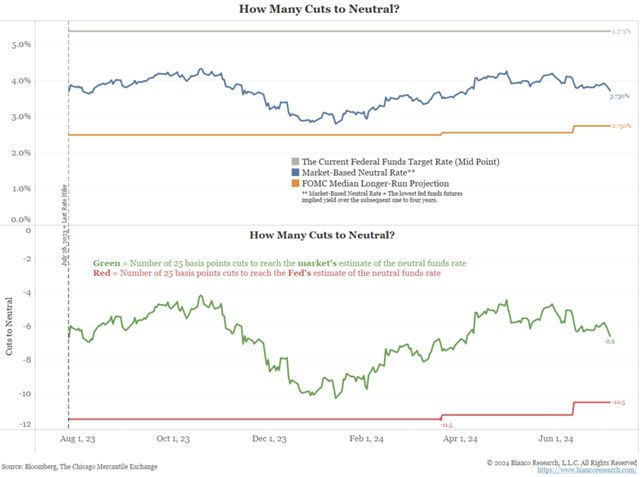
Why does this matter? Figure 7 shows how many 25-bps cuts it will take to return to neutral.
Sources: Bloomberg, The Chicago Mercantile Exchange, Bianco Research, for the period 7/26/23–7/5/24. Start date is meant
to reference 7/26/23, the last rate hike in the current cycle. Past performance is not indicative of future results.
As the bottom panel above shows, the Fed’s neutral estimate of 2.75% means it has to cut rates 10.5 times in 25-bps increments to return to neutral (red line). However, the market estimates that the Fed only needs 6.6 cuts to reach neutral (green line).
Why has the Fed been so insistent on rate cuts this year? With neutral near 2.75%, they believe they have a lot of cutting to do once they start. This is why people like Austan Goolsbee and Mark Zandi want to get started sooner rather than later.
The market, however, is not so sure, which is why their estimate of neutral (blue and green two charts above) is much higher, at 3.70%, and recently over 4%. This reflects different market assumptions between the Fed and the market. The biggest difference is what the “real” interest rate is neutral. Real interest rate are the “nominal” interest rate after subtracting the inflation rate.
Figure 8 shows the real Fed Funds Rate, or the nominal Fed Funds Rate, subtracting core Personal Consumption Expenditures (PCE), the Fed’s preferred measure of inflation.
The latest level is 2.93%. Is this a high level restricting the economy?
The Fed thinks 2.93% is too high. This is because the Fed is anchored to the post-financial crisis (2009) period, or the red part of the chart below. During this period, real rates averaged negative 1.08%. So, the current level of positive 2.93% must seem like a punishing level of interest rates to them. Hence, there are constant calls to start cutting the funds rate sooner rather than later.
However, we believe the market is now looking at the post-financial crisis as an aberration, and the pre-financial crisis period, the blue part of the line to the left below, is closer to neutral. During this period, the real funds rate averaged a positive 2.55%, not far from the current level of positive 2.93%. Hence, the market is far more sanguine about how restrictive the current real rates are for the economy. The stock market continuing to power to new heights supports this idea.
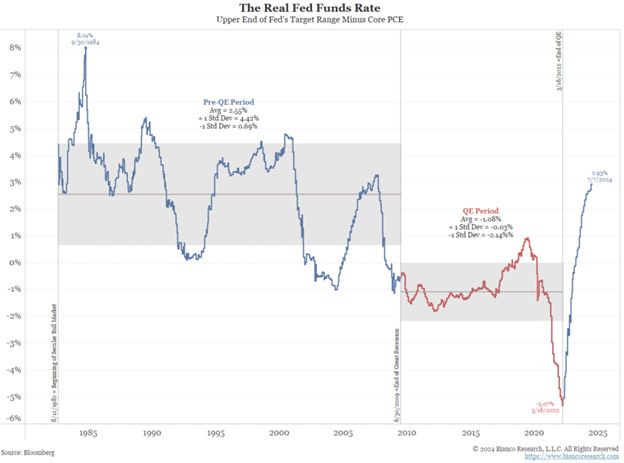
Sources: Bloomberg, Bianco Research, for the period 8/12/1982–7/7/2024, with data starting 8/12/1982, which was the
start of the bull market in bonds, a period characterized by something like 40 years, approximately, of falling interest
rates, generally, and rising bond prices, generally. Past performance is not indicative of future results.
The Fed thinks it is highly restrictive now, while the market thinks it is far less restrictive. As long as this divergence remains, holding rates steady satisfies the market more than the Fed, as the market thinks it is closer to neutral.
However, should the Fed interpret the economic and inflation data as weak enough to cut, the risk is a toxic reaction to an impending policy mistake of cutting too early and by too much.
This puts the bond market at an inflection point as we wait to see whether the Fed is ready to initiate a rate cut. To use a metaphor, it’s like the top of a roller coaster when everything stops. We believe we are at that point now. But the coaster can go on one of several tracks for the rest of the ride. So, we are broadly holding positive and relatively neutral, seeking clarity on the coaster’s tracks that will start the next thrill ride.
We suspect we’ll have that clarity before the end of the summer.
1 Source: Morningstar. All data based on NAV except where noted. Category: Intermediate Core-Plus Bond. Index: Morningstar US Core Plus Bond Total Return USD. Data as of 6/30/24. Morningstar, Inc., 2019. All rights reserved. The information contained herein: (1) is proprietary to Morningstar and/or its content providers; (2) may not be copied or distributed; and (3) is not warranted to be accurate, complete or timely. Neither Morningstar nor its content providers are responsible for any damages or losses arising from any use of this information. Past performance, rankings and ratings are no guarantee of future results. Regarding ranking of
funds, 1 = Best.
2 This blog was partially written by Jim Bianco on his website.
3 Neutral here references a neutral positioning of the level of interest rates, specifically the Federal Open Market Committee’s (FOMCs) policy interest rate, the Federal Funds Rate. The concept is that it is a rate that is not impinging on economic growth, but it is also not too low and encouraging inflation. It could be synonymous with Goldilocks or “just right” and does not reference back to positioning against the benchmark.
Diversification does not guarantee a profit or protect against a loss.
There are risks associated with investing, including the possible loss of principal. Fixed income investments are subject to interest rate risk; their value will normally decline as interest rates rise. Fixed income investments are also subject to credit risk, the risk that the issuer of a bond will fail to pay interest and principal in a timely manner, or that negative perceptions of the issuer’s ability to make such payments will cause the price of that bond to decline. While the Fund attempts to limit credit and counterparty exposure, the value of an investment in the Fund may change quickly and without warning in response to issuer or counterparty defaults and changes in the credit ratings of the Fund’s portfolio investments. The Fund invests in the securities included in, or representative of, its Index regardless of their investment merit, and the Fund does not attempt to outperform its Index or take defensive positions in declining markets. Please read the Fund’s prospectus for specific details regarding the Fund’s risk profile.
Bianco Total Return Fund

Global Chief Investment Officer
Jeremy Schwartz has served as Global Chief Investment Officer since November 2021 and leads WisdomTree’s investment strategy team in the construction of WisdomTree’s equity Indexes, quantitative active strategies and multi-asset Model Portfolios. Jeremy joined WisdomTree in May 2005 as a Senior Analyst, adding Deputy Director of Research to his responsibilities in February 2007. He served as Director of Research from October 2008 to October 2018 and as Global Head of Research from November 2018 to November 2021. Before joining WisdomTree, he was a head research assistant for Professor Jeremy Siegel and, in 2022, became his co-author on the sixth edition of the book Stocks for the Long Run. Jeremy is also co-author of the Financial Analysts Journal paper “What Happened to the Original Stocks in the S&P 500?” He received his B.S. in economics from The Wharton School of the University of Pennsylvania and hosts the Behind the Markets podcast. Jeremy is a member of the CFA Society of Philadelphia.
