
QGRW
U.S. Quality Growth Fund

Published November 4, 2026

Global Head of Research
Decades of empirical asset-pricing research point to a persistent pattern.
Stocks with strong profitability and capital discipline have tended to outperform over time, and so have stocks with durable earnings growth.
Yet these two characteristics are rarely combined systematically in a single strategy. Investors are typically asked to choose a “quality” fund or a “growth” fund, as though the two were competing bets rather than complementary evidence about the same underlying question.
Which businesses have tended to compound value reliably?
The two most widely used large-cap growth benchmarks offer a useful conceptual illustration. The Russell 1000 Growth Index and the S&P 500 Growth Index anchor a large share of growth-oriented funds, and the word “growth” in their names suggests a deliberate effort to own companies that are growing profitably. Their published rules describe something narrower.
The S&P 500 Growth Index1 starts with the S&P 500 and scores each company on three growth factors:
And three value factors:
Once every S&P 500 company has a growth score and a value score, the index sorts the whole list so that companies with the strongest growth scores relative to their value scores sit at the top, and those with the strongest value scores relative to their growth scores sit at the bottom. It then works in from both ends by market capitalization, not by company count.
The result is that every company’s weight across the two indexes sums to 100%. The growth and value indexes each end up holding roughly half of the parent’s market cap, and only the middle third or so of the market is shared between them.
A company enters the growth index by having grown, having risen and being expensive relative to its book value, earnings and sales. Nothing in the process measures how profitable the business is, how much debt it carries or how stable its earnings are.
The Russell 1000 Growth Index2 starts from the 1,000 largest eligible U.S. companies ranked by total market capitalization. Style is set by three variables.
Stocks in the lowest quartile of the composite value score are classified fully as growth, those in the highest quartile fully as value and those in between are split. Russell’s approach is half a valuation screen, and it is the only one of the two to use forward analyst expectations. It still contains no measure of profitability.
The WisdomTree U.S. Quality Growth Fund (QGRW) takes a different approach entirely.3 Rather than relying on size and market capitalization to produce an incidental style tilt, the strategy runs its own independent process that explicitly screens for quality and growth characteristics wherever they occur across its own eligible universe. This piece makes the case that this deliberate approach, combining quality and growth systematically rather than treating them as separate bets or leaving their presence to chance, is better supported by the research than either factor pursued alone.
Sorting companies by gross profitability, revenue minus cost of goods sold, scaled by total assets, Novy-Marx found a return premium comparable in strength to the one long attributed to buying cheap stocks, holding up across a sample stretching from 1973 to 2010.4 Profitable companies outperformed unprofitable ones by a wide margin, even though profitable companies tended to trade at higher valuations. Paying up for quality was not the mistake it looked like on a spreadsheet. The effect held up even among the largest, most liquid stocks, the segment where many market anomalies tend to weaken once trading costs and capacity constraints are considered. The paper was eventually published in the Journal of Financial Economics and became one of the most cited justifications for combining profitability with growth or value exposure in a single strategy.
That finding sat for over a decade as an influential but comparatively narrow academic result. Then, in 2025, Novy-Marx returned to the question with Mamdouh Medhat, this time asking a much bigger one.5
What does profitability actually explain?
Their answer was blunt. The asset management industry’s entire “quality” category, one of the largest and fastest-growing style buckets in the business, turns out to be an indirect route to the same underlying signal Novy-Marx had identified in 2012. Return-on-equity screens, stable-earnings screens, low-leverage screens and long-standing composite metrics like Graham’s G-score all lose their explanatory power once profitability is accounted for directly. The same profitability tilt, the authors found, also prices “defensive equity” strategies built around low-beta or low-volatility stocks, and accounts for roughly half of value investing’s underperformance since 2007. In their framing, profitability isn’t one input into quality investing. It’s the mechanism quality investing was built on the whole time, whether or not the label ever said so, and whether or not the businessperson using it had ever read an asset-pricing paper.
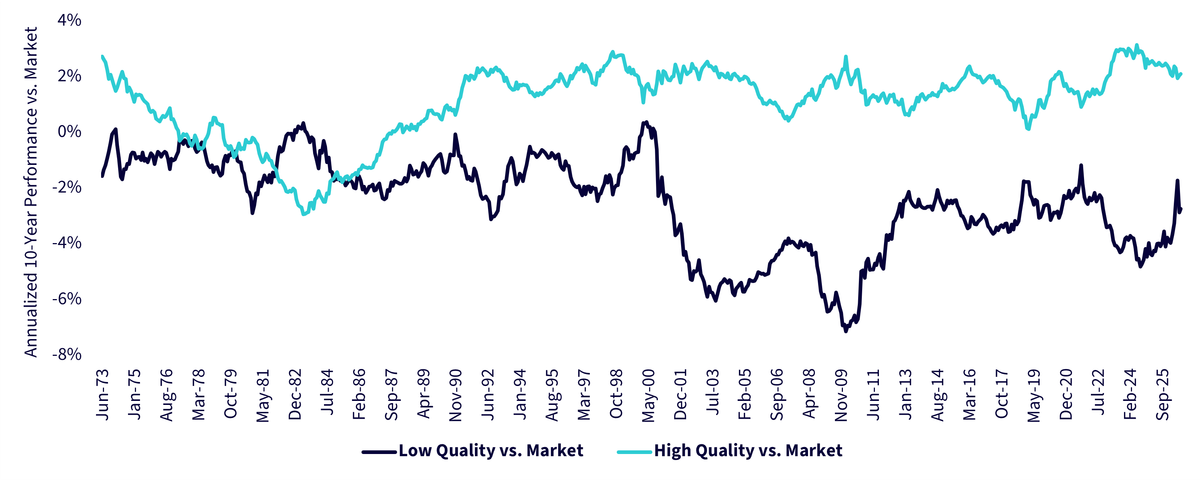
Source: Fama, E. F., & French, K. R. (2026). Portfolios formed on Size and Operating Profitability [Data set]. Kenneth R. French Data Library. Size, i.e., what is a large-cap stock, is denoted by being above the median market capitalization of all listed stocks in the universe. High operating profitability denotes being above the 70th percentile by that metric of all listed stocks. Low operating profitability denotes being below the 30th percentile by that metric of all listed stocks. Period is from 6/30/1963 to 8/31/2026, with the first full 10-year period measured from 6/30/1963 to 6/30/1973. Market is denoted as all listed stocks, taken together. Past performance is not indicative of future results.
The academic case for growth is different in kind from the case for quality, and it’s worth being straightforward about that. If anything, the literature leans the other way, noting that companies priced for rapid growth (“glamour” stocks) have historically underperformed, precisely because the growth embedded in their prices tends not to fully materialize.
What the research does establish, convincingly, is that forward-looking growth expectations are extraordinarily value-relevant, whether or not they turn out to be accurate. Dechow and Sloan (1997) show that stock prices do not reflect naive extrapolation of a company’s own past growth trends, but they do reflect, almost at face value, Wall Street analysts’ consensus long-term earnings growth forecasts.6 The catch is that those forecasts are systematically overoptimistic, predicting growth at roughly three times the rate companies actually go on to deliver. Because the market prices in this optimism and then experiences its slow correction, naive reliance on analysts’ growth forecasts accounts for over half of the return to standard value and contrarian strategies in their tests.
The implication for methodology is narrower than it was for quality, but it also explains why the two pillars aren’t independent bets. Consensus forward-looking growth estimates are not noise, and they are one of the most powerful, price-moving pieces of information in the market, which is exactly why they can’t be used uncritically. A strategy that incorporates forward-looking growth data without a profitability filter risks buying precisely the optimism Dechow and Sloan describe, paying for growth the analyst community expects but that the underlying business may never deliver.
This is where the profitability case from the previous section does its real work: pairing forward growth estimates with the same profitability discipline that Novy-Marx, and Munger before him, identified as the thing that actually separates a durable business from a story stock gives the growth signal something to be disciplined by.
QGRW’s quality score is built using the following to score potential constituents.
The “Quality” Measurement
These are not identical to Novy-Marx’s original gross-profits-to-assets construction, but they sit in the same family of capital-efficiency metrics the profitability literature has spent two decades validating.
The “Growth” Measurement
QGRW’s growth score is built using the following to score potential constituents.
These are realized numbers a company has already booked, not ones an analyst hopes it will. The forecast gets a voice, but not a veto, and the check on its optimism is historical fact, not another estimate.
Quality and growth are each weighted 50% into a single Composite Quality Growth Rank across the 500 largest U.S. equities, and only the top quintile, the top 100, is selected.
A company can’t buy its way past a profitability problem with a hot growth forecast, or coast on legacy returns without demonstrated growth; it has to clear the bar on both, combined.
None of this promises outperformance, and Novy-Marx’s own retrospective is candid that profitability premia have compressed since publication, and analyst optimism isn’t going away. However, it’s worth returning to where this piece started. The iShares Russell 1000 Growth ETF (IWF) is built to track the total return performance of the Russell 1000 Growth Index, and the iShares S&P 500 Growth ETF (IVW) is built to track the total return performance of the S&P 500 Growth Index. These are among the largest “growth-focused” ETFs in the U.S. market, which raises the question:
Has the live performance history of QGRW, thus far, been able to outperform the iShares Russell 1000 Growth ETF (IWF) and the iShares S&P 500 Growth ETF (IVW)?
While we cannot know what the future will bring, Figure 2a indicates that over a period that is getting toward but not quite reaching four years, the record is looking pretty good.
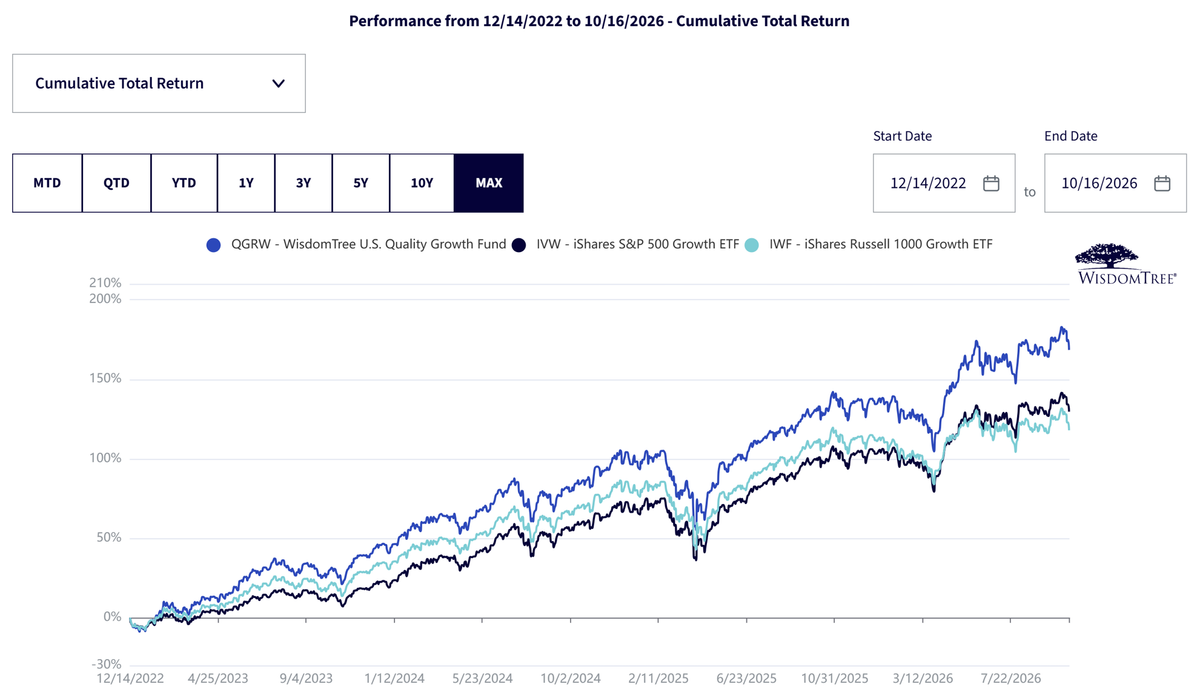
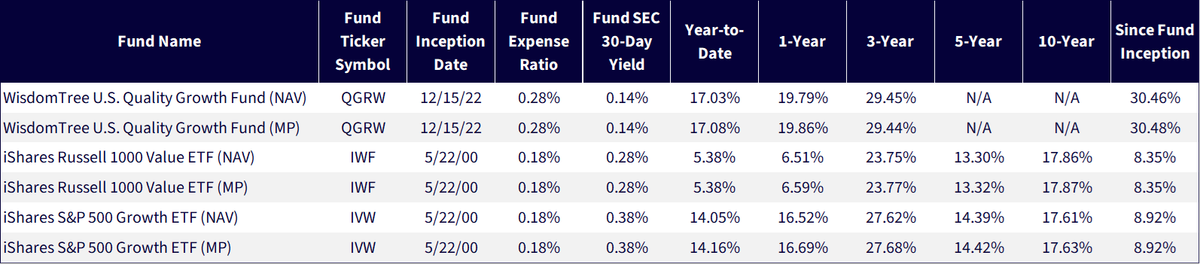
Sources: Morningstar, FactSet and WisdomTree, specifically data from the PATH Fund Comparison Tool, accessed as of October 17, 2026, but showing returns for the period ended October 16, 2026 for Figure 2a and September 30, 2026 for Figure 2b. NAV denotes total return performance at net asset value. MP denotes market price performance. Past performance is not indicative of future results. Investment return and principal value of an investment will fluctuate so that an investor’s shares, when redeemed, may be worth more or less than their original cost. Current performance may be lower or higher than the performance data quoted. For the most recent month-end and standardized performance, click the relevant ticker: , IWF, IVW.
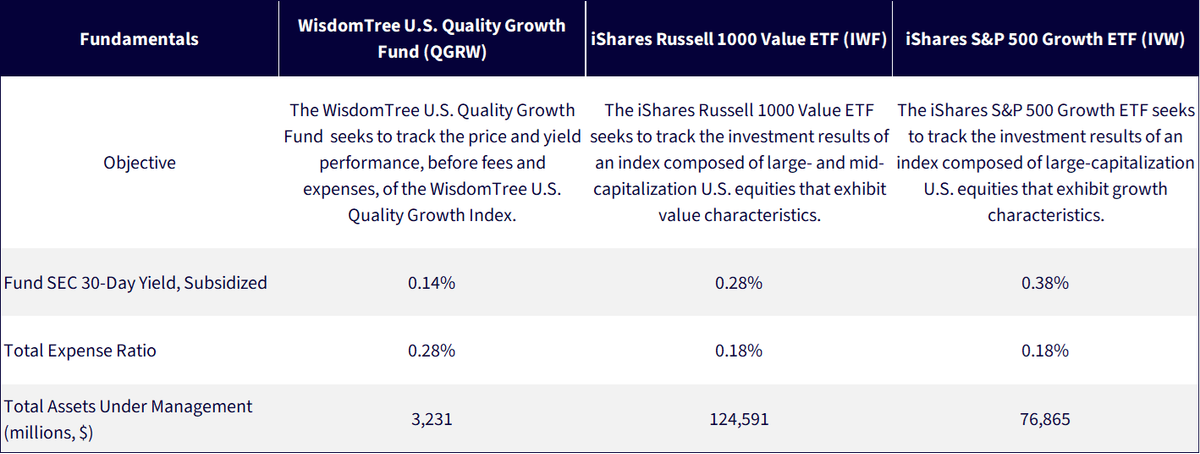
Sources: WisdomTree and Invesco, with AUM data sourced from specific fund pages as of October 16, 2026. Subject to change.
1 Source for methodology details that follow: S&P Dow Jones Indices (2026, June). S&P U.S. Style Indices Methodology.
2 Source for methodology details that follow: FTSE Russell (2026, August). Russell US Equity Indexes: Construction and Methodology, v7.2.
3 The WisdomTree U.S. Quality Growth Fund (QGRW) is designed to track the total return performance, before fees and expenses, of the WisdomTree U.S. Quality Growth Index. This Index does rank constituents for inclusion based on both quality and growth characteristics.
4 Source: Novy-Marx, R. (2013). The other side of value: The gross profitability premium. Journal of Financial Economics, 108(1), 1–28.
5 Source: Novy-Marx, R., & Medhat, M. (2025). Profitability retrospective: What have we learned? (NBER Working Paper No. 33601). National Bureau of Economic Research.
6 Source: Dechow, P. M., & Sloan, R. G. (1997). Returns to contrarian investment strategies: Tests of naive expectations hypotheses. Journal of Financial Economics, 43(1), 3–27.
All funds are managed differently and do not react the same to economic or market events. The investment objectives, strategies, policies or restrictions of other funds may differ and more information can be found in their respective prospectuses. Therefore, we generally do not believe it is possible to make direct fund to fund comparisons in an effort to highlight the benefits of a fund versus another similarly managed fund.
There are risks associated with investing, including possible loss of principal. Growth stocks, as a group, may be out of favor with the market and underperform value stocks or the overall equity market. Growth stocks are generally more sensitive to market movements than other types of stocks. The Fund is non-diversified; as a result, changes in the market value of a single security could cause greater fluctuations in the value of Fund shares than would occur in a diversified fund. The Fund invests in the securities included in, or representative of, its Index regardless of their investment merit and the Fund does not attempt to outperform its Index. The composition of the Index is governed by an Index Committee and the Index may not perform as intended. Please read the Fund’s prospectus for specific details regarding the Fund’s risk profile.
For additional risk disclosures, click the relevant ticker: IWF, IVW.
U.S. Quality Growth Fund

Global Head of Research
Christopher Gannatti began at WisdomTree as a Research Analyst in December 2010, working directly with Jeremy Schwartz, CFA®, Director of Research. In January of 2014, he was promoted to Associate Director of Research where he was responsible to lead different groups of analysts and strategists within the broader Research team at WisdomTree. In February of 2018, Christopher was promoted to Head of Research, Europe, where he was based out of WisdomTree’s London office and was responsible for the full WisdomTree research effort within the European market, as well as supporting the UCITs platform globally. In November 2021, Christopher was promoted to Global Head of Research, now responsible for numerous communications on investment strategy globally, particularly in the thematic equity space. Christopher came to WisdomTree from Lord Abbett, where he worked for four and a half years as a Regional Consultant. He received his MBA in Quantitative Finance, Accounting, and Economics from NYU’s Stern School of Business in 2010, and he received his bachelor’s degree from Colgate University in Economics in 2006. Christopher is a holder of the Chartered Financial Analyst Designation.

