

7 Market Dislocations Too Big to Overlook
Published November 24, 2025

Jeff Weniger, CFA
Head of Equity Strategy
Key Takeaways
- High-quality stocks have dramatically underperformed lower quality stocks in 2025, echoing extremes last seen in 1999.
- Despite near-record highs in the S&P 500, fundamentals are deteriorating beneath the surface as free cash flow issues materialize in the Mag 7.
- With nearly a third of the S&P 1500 trading at price-to-earnings ratios (P/Es) above 50x, WTV and DGRW may offer prudent risk-adjusted exposure if the tide turns.
The S&P 500 Quality Index has lagged the S&P 500 by 8.9 percentage points over the last six months. The last time anything like this happened was in 1999 (figure 1).
Figure 1: High-Quality Stocks' Underperformance Is at 1999 Extremes
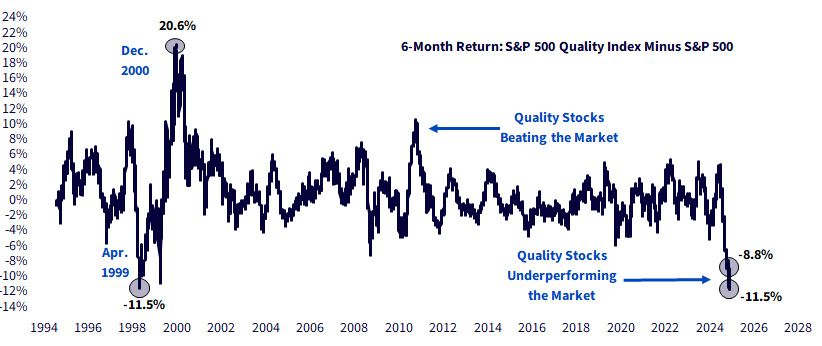
Source: Refinitiv, as of 11/20/25. Quality is based on Refinitiv’s quality factor scores (profitability, earnings stability and leverage) for S&P 500 constituents; higher scores = high-quality, lower scores = low-quality.
Similarly, the "junky" small-cap Russell 2000, which has 29% of its market cap in unprofitable companies, has crushed its higher-quality competitor, the S&P 600 (figure 2).
Figure 2:Russell 2000 Minus S&P 600 Performance Differential, Last NineMonths
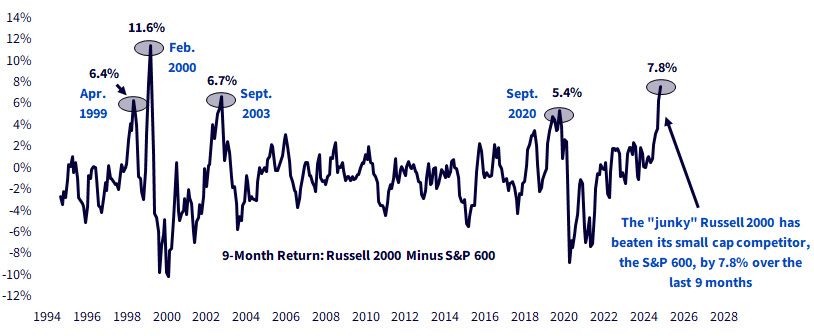
Source: Refinitiv, as of 10/31/25.
By the way, we have a free cash flow problem in the six non-NVIDIA names of the Mag 7 (figure 3).
Figure 3: Total Free Cash Flow of Apple + Microsoft + Amazon + Alphabet + Tesla + Meta, Last 12 Months
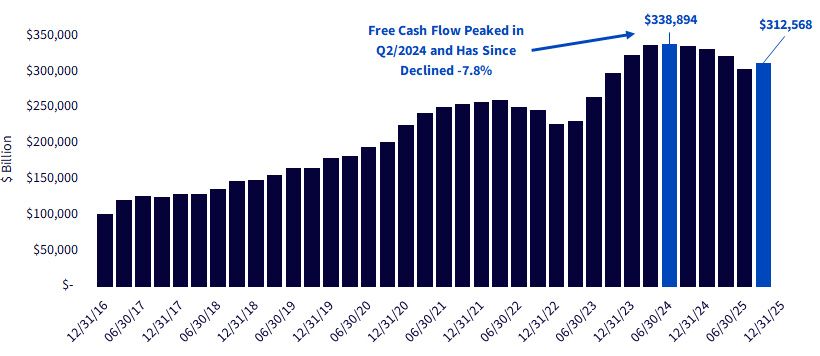
Source: Refinitiv, as of Q3 2025.
The S&P 1500 has 30.9% of its market cap in stocks with price-to-earnings ratios (P/Es) above 50x reported earnings (figure 4).
Figure 4: S&P 1500 by Reported P/E Multiple
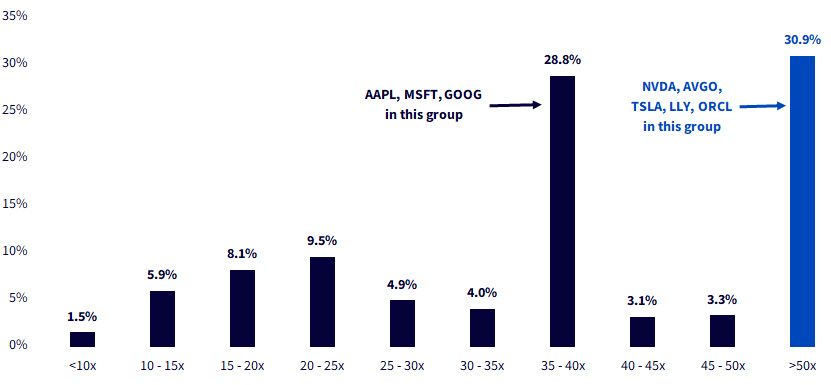
Refinitiv, as of 11/21/25, using reported earnings. Example: 1.5% of the S&P 1500's total value is in stocks with P/Es below 10.
This makes figure 5 so intriguing. The S&P 500 Growth Index divided by the S&P 500 Value Index is at a multi-year moment of truth.
Figure 5: S&P 500 Growth Divided by S&P 500 Value
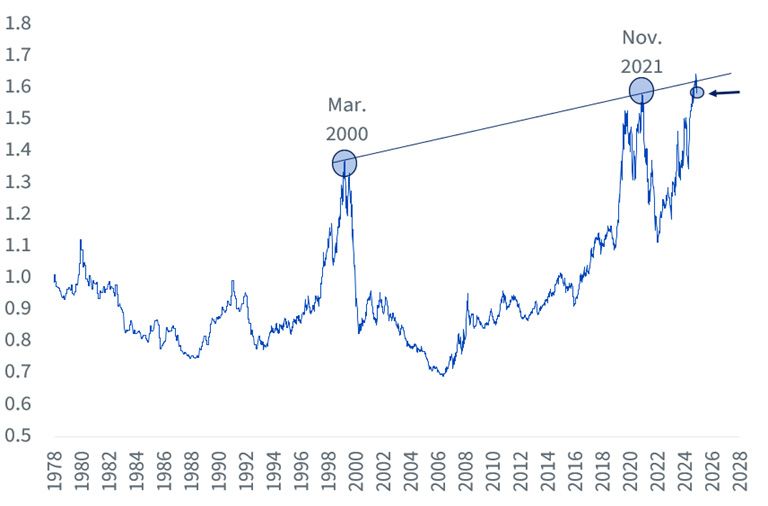
Source: Refinitiv, as of 11/20/25, using total return indexes.
Oil is in the tank (see what I did there?), while Energy's S&P weight is down to 3.0%. If oil rallies due to AI demands on the electric grid, in our opinion, a lot of investors will basically miss it.
Figure 6: Crude Oil Divided by S&P 500: At 1998 and COVID-19Levels
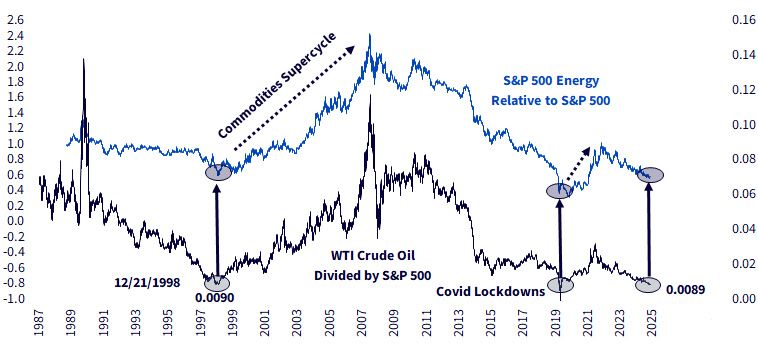
Source: Refinitiv, as of 11/21/25.
Of all my charts, figure 7 is the most troubling. From their recent highs, Carlyle (-26.2%), Blackstone (-25.8%) and KKR (-23.2%) have been badly clipped. The S&P 500 has barely backed off from the recent highs.
Figure 7: The S&P 500 Is Near Record Highs While Private Equity Breaks Down
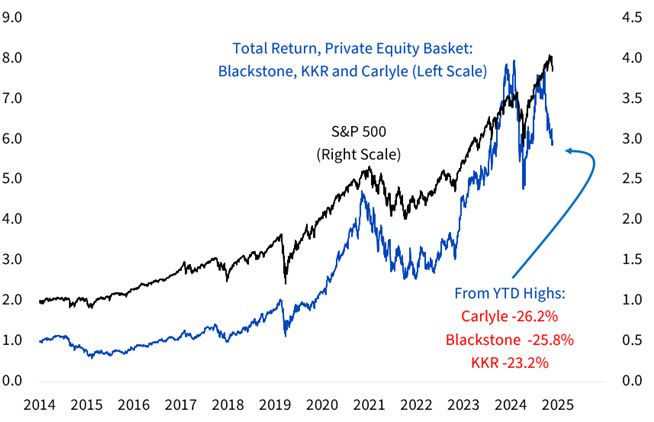
Source: Refinitiv, using total return of an equal-weighted basket of BX, KKR and CG, as of 11/20/25.
Here are a couple of Funds that I think could potentially do better than the S&P 500 if the market's vibe turns toward prudence.
The WisdomTree U.S. Value Fund (WTV)has 1.5% in Alphabet, 1.4% in Meta and no other Mag 7 exposure, as of November 21, 2025.
The WisdomTree U.S. Quality Dividend Growth Fund (DGRW)is generally under-weight in the Mag 7 due to its dividend requirement.
If you like these charts, sign up to view our Office Hourswebinars. Register here.
Important Risks Related to this Article
You cannot invest directly in an index.
For current fund holdings, please click the respective ticker: DGRW, WTV. Holdings are subject to risk and change.
DGRW: There are risks associated with investing, including the possible loss of principal. Funds focusing their investments on certain sectors increase their vulnerability to any single economic or regulatory development. This may result in greater share price volatility. Dividends are not guaranteed, and a company currently paying dividends may cease paying dividends at any time. Please read the Fund’s prospectus for specific details regarding the Fund’s risk profile.
WTV: There are risks associated with investing, including the possible loss of principal. Funds focusing their investments on certain sectors increase their vulnerability to any single economic or regulatory development. This may result in greater share price volatility. While the Fund is actively managed, the Fund’s investment process is expected to be heavily dependent on quantitative models, and the models may not perform as intended. Please read the Fund’s prospectus for specific details regarding the Fund’s risk profile.

About the contributor

Jeff Weniger, CFA
Head of Equity Strategy
Jeff Weniger, CFA, has been with WisdomTree since 2017 and serves as the Head of Equities. He shapes the firm’s market outlook through a combination of macroeconomic and fundamental analysis. With more than two decades in investment strategy, Jeff is known for his work on market cycles and valuations. Before joining WisdomTree, Jeff was with BMO Private Bank and BMO Global Asset Management for 11 years. At BMO, he sat on the firm’s Asset Allocation Committee and co-managed ETF model portfolios across the U.S. and Canada. In 2013, at age 32, he became the youngest member of BMO’s Global Investment Forum. When he left BMO to come to WisdomTree, his final role was Director, Senior Strategist in the Office of the CIO in 2017.
Jeff is a frequent television guest on networks such as CNBC, Bloomberg, and Schwab, with regular print appearances in The Wall Street Journal, Barron’s and Reuters. He also appears weekly on the Behind the Markets podcast and is a regular on SiriusXM’s The Business Briefing. On X, Jeff has developed one of the larger followings in financial media. He earned a B.S. in Finance from the University of Florida and an MBA from the University of Notre Dame. He has held the CFA charter since 2006.