GDE
Efficient Gold Plus Equity Strategy Fund

Published May 8, 2025

Global Head of Research

Global Chief Investment Officer
Gold and stocks serve fundamentally different roles in a portfolio, and history makes their contrast crystal clear.
Over the past two centuries, gold has been a relatively stable store of purchasing power, offering real returns of just 0.8% per year—barely ahead of inflation. It's inert by design: it yields nothing, it doesn't grow, and it doesn't compound. Its primary function is wealth preservation, especially in times of political upheaval, monetary disorder or inflation shocks. In contrast, stocks represent dynamic claims on real assets—productive enterprises with reinvestment, growth and innovation embedded in their structure. From 1802 to April 2025, a diversified equity portfolio delivered real returns of nearly 7% annually, compounding purchasing power exponentially over generations.
The true edge of stocks lies in time and reinvestment.
A dollar invested in equities in 1802 would have grown to more than $2.4 million in real terms by April 2025; the same dollar in gold would be worth just $6.38.
In figure 1:
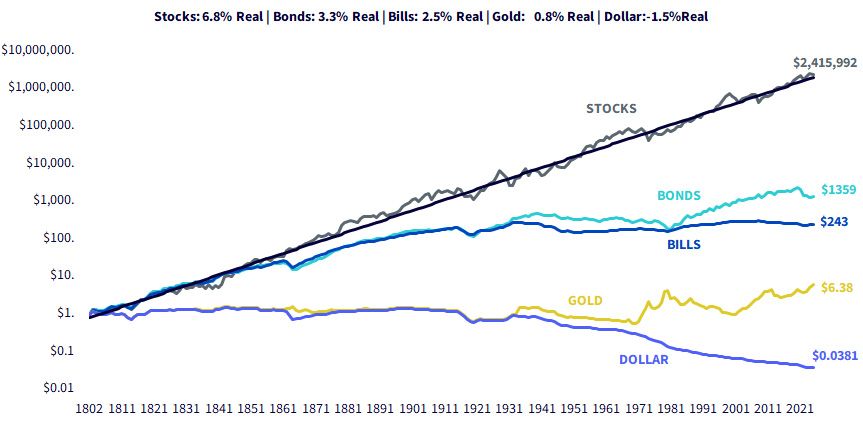
Source: Jeremy Siegel, Stocks for the Long Run (2022) with updates to 2025. Past performance is not indicative of future results. You cannot invest directly in an index. Stocks: The total returns after inflation on the broadest index of stocks available at the time. (Stocks-real-total return index: 1802-2025). Bonds: The total returns on an index on U.S. government bonds after inflation. (Bonds-real-total return index: 1802-2025). Bills: Total returns on U.S. Treasury Bills after inflation. (Bills-real-accumulative index: 1802-2024). Gold: The value of 1 dollar of gold bullion after inflation. (Gold-real-price index: 1802-2025). Dollar : The purchasing power of one US dollar. (Money: 1802-2025).
These disparities grow even more striking when reinvested dividends and corporate earnings growth are considered. Despite all the crashes, wars and crises, equities have persistently outpaced not just gold, but every other asset class in terms of long-run performance. And importantly, stocks become less risky than bonds or gold over long holding periods—contrary to conventional wisdom. Siegel's data demonstrates that over any 20-year period, stocks have always maintained purchasing power and often delivered positive real returns even when other assets faltered.
Yet 2025 is adding an intriguing twist to the historical script.
Gold has surged in popularity amid mounting geopolitical tensions, rising central bank purchases (especially by BRICS1 nations) and a market increasingly wary of fiat currency degradation. With inflation having surprised to the upside in several economies, and the prospect of structurally higher government debt levels, investors are revisiting gold not merely as a hedge but as a speculative asset with short-run return potential. This is a break from its long-standing role—people aren't just hedging, they're chasing. That's not unprecedented (e.g., the 1970s), but it's rare.
Some may see that reference to the 1970s and recall that the U.S. dollar was backed by gold until 1971, when President Nixon broke this link. We can measure the performance of the different assets in figure 1 from this specific point to see what has transpired. Figure 2 shows:
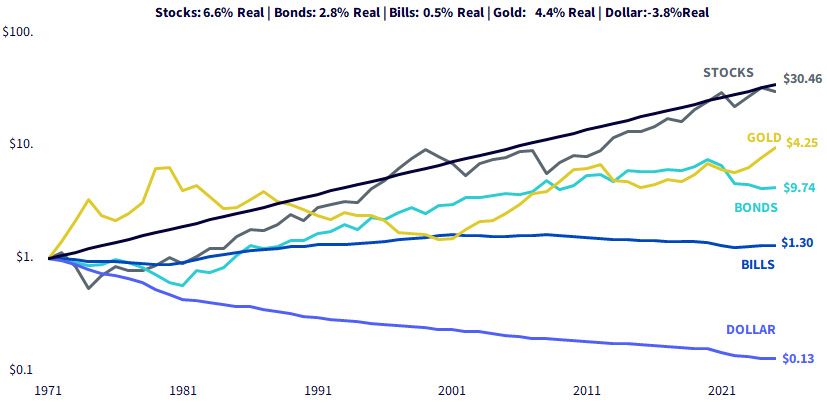
Source: Jeremy Siegel, Stocks for the Long Run (2022) with updates to 2025. Past performance is not indicative of future results. You cannot invest directly in an index. Stocks: The total returns after inflation on the broadest index of stocks available at the time. (Stocks-real-total return index: 1802-2025). Bonds: The total returns on an index on U.S. government bonds after inflation. (Bonds-real-total return index: 1802-2025). Bills: Total returns on U.S. Treasury Bills after inflation. (Bills-real-accumulative index: 1802-2024). Gold: The value of 1 dollar of gold bullion after inflation. (Gold-real-price index: 1802-2025). Dollar : The purchasing power of one US dollar. (Money: 1802-2025).
This cyclical interest in gold may offer tactical opportunities, but structurally, the long game still favors equities.
Investors must weigh the current enthusiasm for gold against its long-run limitations. Stocks, by contrast, continue to benefit from reinvested earnings, global innovation cycles and a compounding engine gold simply doesn't possess. In that sense, gold may shine temporarily in 2025's macro fog, but equities remain the vehicle most likely to deliver lasting wealth creation across decades.
When evaluating gold in the context of long-term portfolio allocation, the fundamental challenge is not with gold itself, but with what must be sacrificed to hold it.
Gold, historically, preserves purchasing power and offers protection in certain macro environments. Yet it offers no earnings, dividends or internal compounding engine. Consequently, funding a gold allocation usually requires reducing exposure to other assets—most notably equities. Given Professor Siegel's extensive data, which shows equities compounding real wealth at approximately 6.8% per year over two centuries, diverting capital from equities carries an opportunity cost. If the long-term outperformance of equities persists, as history overwhelmingly suggests it might, then allocating too heavily to gold risks meaningfully lower long-run portfolio growth.
Gold may shine in certain environments: monetary debasement, geopolitical upheaval, inflation spikes. In the short run, these can justify tactical gold exposures. However, the key question for the strategic, long-term investor is what gets displaced. Historically, taking dollars away from equities—arguably the highest real-returning asset class ever recorded—has been costly when measured over decades. Thus, for investors deeply focused on long-horizon wealth creation, the real risk is not holding gold per se, but reducing compounding equity exposure during periods when stocks continue their historical dominance.
Rather than funding a gold position directly by selling equities, investors can use capital-efficient exposures that embed derivatives or alternative structuring techniques to maintain effective equity market participation while layering in additional assets like gold. In this way, investors can achieve additive exposure to gold without necessarily diluting their equity beta. This approach does not eliminate uncertainty—future returns on any asset class are always unknowable—but it does mitigate the opportunity cost risk associated with mechanically reallocating from equities into gold.
It enables investors to engage with the tactical case for gold (especially relevant in 2025's volatile macro environment) while still honoring the structural advantage of equities over the long term. In short, if Siegel's framework remains directionally correct—that equities are the engine of long-term real wealth—then capital-efficient strategies could allow investors to "have their cake and eat it too": participating in potential short-run gold upside while minimizing the long-run compounding penalty of stepping away from equities.
We thought it could be useful to explore how an allocation to gold could impact a portfolio of U.S. assets, starting at 60% equities and 40% fixed income.
Looking at figure 3, we can see that Blending Gold (50/40/10) is taking the traditional approach. GLD at 10% represents one-fifth the relative exposure to U.S. equities, with IVV at 50%.
Within Capital Efficient Gold Blend, we are using two capital-efficient ETF allocation tools. Allocating 83.3% to NTSX leads us to a U.S. equity starting point of 75%. If we then allocate 16.7% to GDE, we get a 15% overall gold exposure. Fifteen percent is one-fifth of the 75%.
But Capital Efficient Gold Blend does not stop there. GDE also generates 15% exposure to U.S. equities, bringing the total U.S. equity exposure to 90%. If one had placed 100% of the allocation into NTSX, by design, this would also generate 90% exposure to U.S. equities. Therefore, it is like we added GDEand did not take anything away from U.S. equities. Of course, capital efficient exposure is not a "free lunch," in the sense that using leverage in this way can increase volatility. To think about risk, the worst case would be if U.S. equities, U.S. fixed income and gold are all going down during the same time frame. Historical analysis indicates that this has not happened often on a calendar year basis, but 2022 would be the most recent such year.
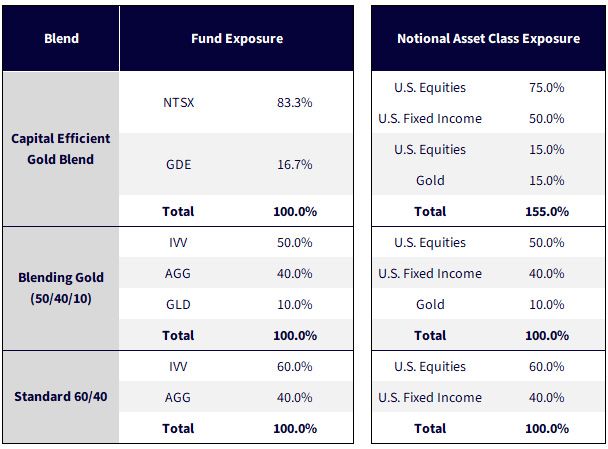
Source: WisdomTree. IVV is an investment vehicle designed to track the price and yield performance, before fees, of the S&P 500 Index. It is one of the largest ETFs in the market on the basis of AUM that tracks this specific benchmark. This specific benchmark is the most widely followed for the performance of U.S. equities. AGG is an investment vehicle designed to track the price and yield performance, before fees, of the Bloomberg U.S. Aggregate Bond Index. This ETF is the largest by AUM that is tracking the returns of this benchmark, and this benchmark is the most widely followed for the performance of a broad selection of investment-grade U.S. bonds. GLD is an investment vehicle designed to track the price of gold, before fees. It is the largest strategy designed to track movements in the spot price of gold.
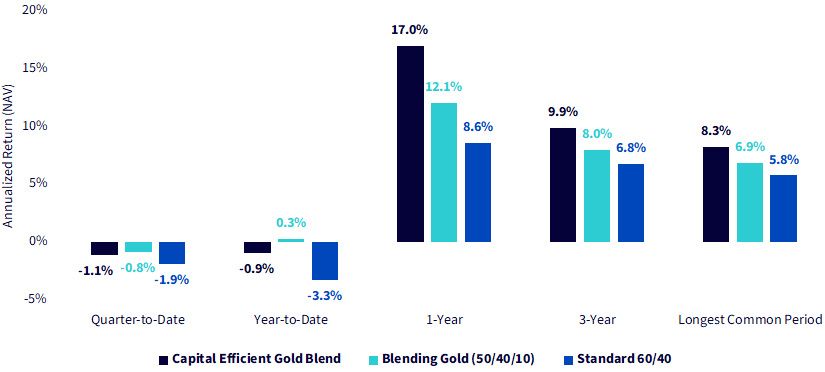
Figure 4 shows the standardized period returns of the different blends as well as the different ETFs that are used to create them.
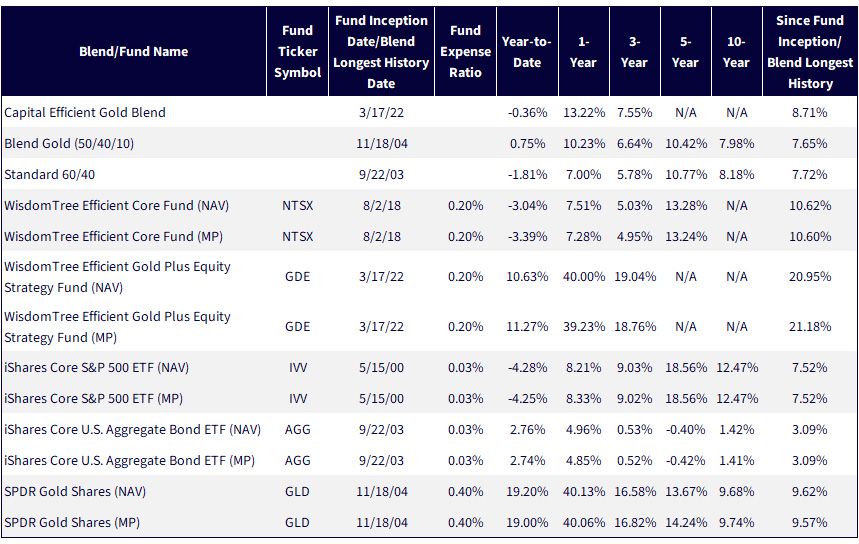
Sources: WisdomTree, FactSet, Morningstar, specifically data from the Fund Comparison Tool in the PATH suite of tools, accessed 4/26/25, with returns as of 3/31/25. NAV denotes total return performance at net asset value. MP denotes market price performance. The performance data quoted represents past performance. Past performance is not indicative of future results. Investment return and principal value of an investment will fluctuate so that an investor's shares, when redeemed, may be worth more or less than their original cost. Current performance may be lower or higher than the performance data quoted. For the most recent month-end and standardized performances, click the relevant ticker: NTSX, GDE, IVV, AGG, GLD.
In figure 5, due to the available history of GDE, we can look at two full calendar years.
These years were characterized by strong, upwardly trending U.S. equities driven largely by the largest companies. The Standard 60/40 delivered 18% in 2023 and 15.5% in 2024. The returns of Blending Gold (50/40/10), which basically took 10% from IVV and placed it in GLD, were very similar.
The Capital Efficient Gold Blend notably outperformed. This is because the capital-efficient approach did not allocate to gold at the expense of equities. Many might note, correctly, that this is just two years, but these two years do illustrate the behavior of these blends in the face of at least one important risk: the risk of allocating to gold before a strong upwardly trending U.S. equity market.
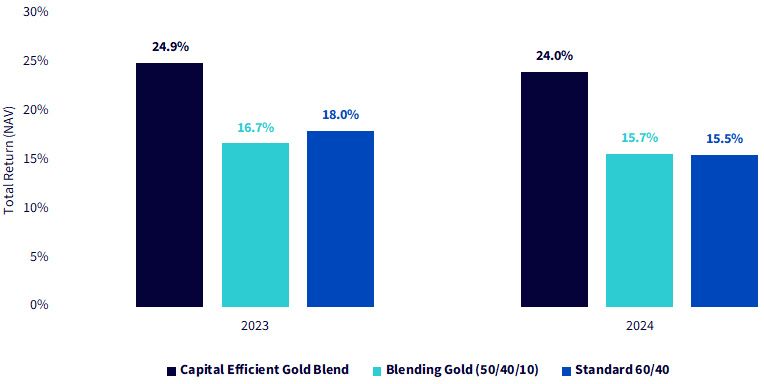
Sources: WisdomTree, FactSet, Morningstar, specifically data from the Fund Comparison Tool in the PATH suite of tools, accessed 4/26/25, with returns as of 12/31/22 to 12/31/23 (2023) and 12/31/23 to 12/31/24 (2024). NAV denotes total return performance at net asset value. Past performance is not indicative of future results. Investment return and principal value of an investment will fluctuate so that an investor's shares, when redeemed, may be worth more or less than their original cost. Current performance may be lower or higher than the performance data quoted. For the most recent month-end and standardized performances, click the relevant ticker: NTSX, GDE.
The first four months of 2025 will not be remembered for a smooth, upward-trending path of U.S. equity performance.
Sources: WisdomTree, FactSet, Morningstar, specifically data from the Fund Comparison Tool in the PATH suite of tools, accessed 4/26/25, with returns as of 4/24/25. The longest common period is from the inception of GDE: 3/17/22. NAV denotes total return performance at net asset value. Past performance is not indicative of future results. Investment return and principal value of an investment will fluctuate so that an investor's shares, when redeemed, may be worth more or less than their original cost. Current performance may be lower or higher than the performance data quoted. For the most recent month-end and standardized performances, click the relevant ticker: NTSX, GDE.
When we pulled up the rolling 12-month periods (limited due to GDEhaving just more than three years of total live history), we saw something surprising.
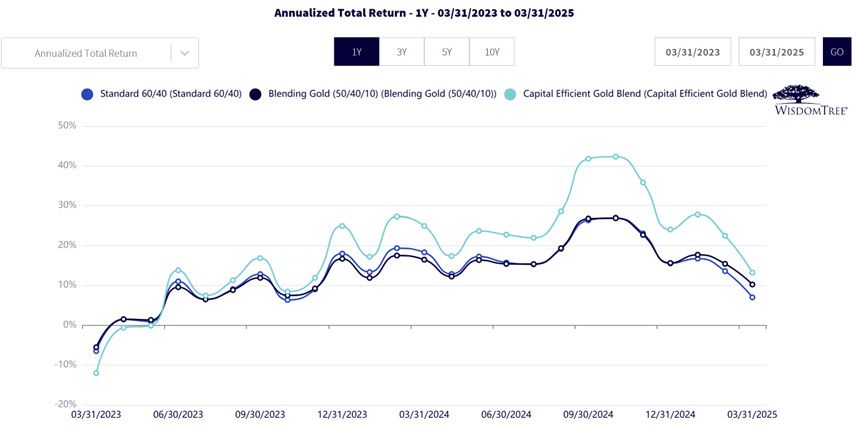
Sources: WisdomTree, FactSet, Morningstar, specifically data from the Fund Comparison Tool in the PATH suite of tools, accessed 4/26/25, with returns as of 3/31/25. NAV denotes total return performance at net asset value. Past performance is not indicative of future results. Investment return and principal value of an investment will fluctuate so that an investor's shares, when redeemed, may be worth more or less than their original cost. Current performance may be lower or higher than the performance data quoted. For the most recent month-end and standardized performances, click the relevant ticker: NTSX, GDE.
At its core, the debate about gold versus equities is a test of how investors think about time, risk and opportunity. Gold shines when fear dominates, but equities build enduring wealth when patience prevails—a truth reinforced across centuries of market history and crisply articulated in Stocks for the Long Run. The real risk with gold isn't that it fails; it's that by funding it through reduced equity exposure, investors may quietly surrender the engine of real compounding. Yet today's portfolio tools, like WisdomTree's capital-efficient strategies, offer a more sophisticated way forward: a chance to embrace the tactical advantages of gold without abandoning the structural advantages of stocks. In a market defined by new threats and new technologies, the smartest investors aren't making blunt trade-offs—they're finding ways to stack advantages. The future belongs to those who can hedge wisely without giving up their claim on growth.
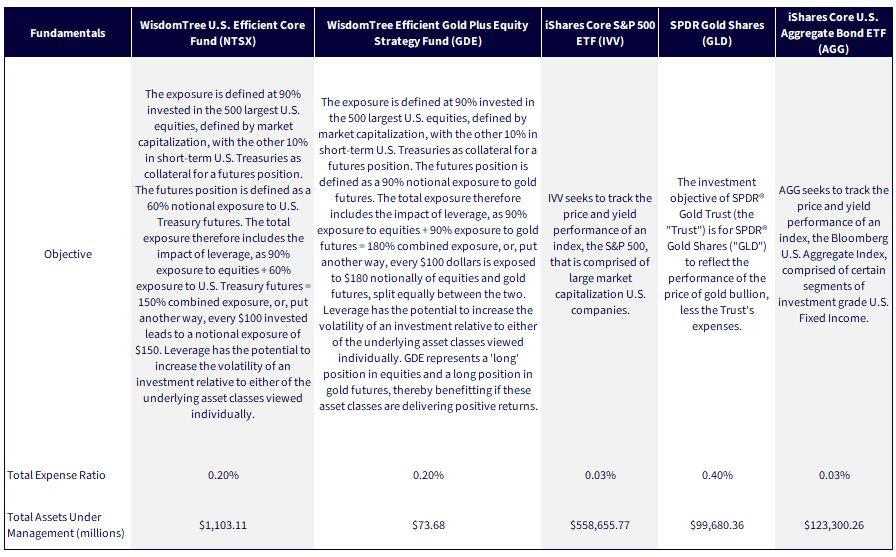
Sources: WisdomTree, iShares, SPDR, as of 4/25/25. Past performance is not indicative of future results. Investment return and principal value of an investment will fluctuate so that an investor's shares, when redeemed, may be worth more or less than their original cost. Current performance may be lower or higher than the performance data quoted. For standard performance of the Funds mentioned in the table, please click their respective tickers: NTSX, GDE, IVV, AGG, GLD.
1 Refers to Brazil, Russia, India, China and South Africa.
Source for all data in this blog post unless otherwise noted: J.J. Siegel & J. Schwartz, (2022), Stocks for the long run: The definitive guide to financial market returns and long-term investment strategies (6th ed.), McGraw Hill.
NTSX: There are risks associated with investing, including the possible loss of principal. While the Fund is actively managed, the Fund’s investment process is expected to be heavily dependent on quantitative models, and the models may not perform as intended. Equity securities, such as common stocks, are subject to market, economic and business risks that may cause their prices to fluctuate. The Fund invests in derivatives to gain exposure to U.S. Treasuries. The return on a derivative instrument may not correlate with the return of its underlying reference asset. The Fund’s use of derivatives will give rise to leverage, and derivatives can be volatile and may be less liquid than other securities. As a result, the value of an investment in the Fund may change quickly and without warning, and you may lose money. Interest rate risk is the risk that fixed income securities, and financial instruments related to fixed income securities, will decline in value because of an increase in interest rates and changes to other factors, such as perception of an issuer’s creditworthiness. Please read the Fund’s prospectus for specific details regarding the Fund’s risk profile.
GDE: There are risks associated with investing, including the possible loss of principal. The Fund is actively managed and invests in U.S.-listed gold futures and U.S. equity securities. The Fund’s use of U.S.-listed gold futures contracts will give rise to leverage, magnifying gains and losses and causing the Fund to be more volatile than if it had not been leveraged. Moreover, the price movements in gold and gold futures contracts may fluctuate quickly and dramatically and have a historically low correlation with the returns of the stock and bond markets. U.S. equity securities, such as common stocks, are subject to market, economic and business risks that may cause their prices to fluctuate. The Fund’s investment strategy will also require it to redeem shares for cash or to otherwise include cash as part of its redemption proceeds, which may cause the Fund to recognize capital gains. Please read the Fund’s prospectus for specific details regarding the Fund’s risk profile.
IVV: Carefully consider the Fund’s investment objectives, risk factors and charges and expenses before investing. This and other information can be found in the Fund’s prospectus, and, if available, summary prospectus, which may be obtained by calling 1-800-iShares (1-800-474-2737) or by visiting www.iShares.com or www.blackrock.com. Read the prospectus carefully before investing. Investing involves risk, including the possible loss of principal. Diversification may not protect against market risk or loss of principal. Shares of ETFs are bought and sold at market price (not NAV) and are not individually redeemed from the Fund. Any applicable brokerage commissions will reduce returns. The iShares Funds are not sponsored, endorsed, issued, sold or promoted by S&P Dow Jones Indices LLC, nor does this company make any representation regarding the advisability of investing in the Funds. BlackRock is not affiliated with S&P Dow Jones Indices LLC. BlackRock provides compensation in connection with obtaining or using third-party ratings and rankings. © 2025 BlackRock, Inc. or its affiliates. All rights reserved. iSHARES, iBONDS and BLACKROCK are trademarks of BlackRock, Inc., or its affiliates. All other trademarks are those of their respective owners. FOR MORE INFORMATION, VISIT WWW.ISHARES.COM OR CALL 1-800 ISHARES (1-800-474-2737).
AGG: Carefully consider the Fund’s investment objectives, risk factors and charges and expenses before investing. This and other information can be found in the Fund’s prospectus and, if available, summary prospectus, which may be obtained by calling 1-800-iShares (1-800-474-2737) or by visiting www.iShares.com or www.blackrock.com. Read the prospectus carefully before investing. Investing involves risk, including the possible loss of principal. Fixed income risks include interest rate and credit risk. Typically, when interest rates rise, there is a corresponding decline in bond values. Credit risk refers to the possibility that the bond issuer will not be able to make principal and interest payments. Diversification may not protect against market risk or loss of principal. Shares of ETFs are bought and sold at market price (not NAV) and are not individually redeemed from the Fund. Any applicable brokerage commissions will reduce returns. The iShares Funds are distributed by BlackRock Investments, LLC (together with its affiliates, “BlackRock”). The iShares Funds are not sponsored, endorsed, issued, sold or promoted by Bloomberg, nor does this company make any representation regarding the advisability of investing in the Funds. BlackRock is not affiliated with Bloomberg. BlackRock provides compensation in connection with obtaining or using third-party ratings and rankings. © 2025 BlackRock, Inc. or its affiliates. All rights reserved. iSHARES, iBONDS and BLACKROCK are trademarks of BlackRock, Inc. or its affiliates. All other trademarks are those of their respective owners. FOR MORE INFORMATION, VISIT WWW.ISHARES.COM OR CALL 1-800 ISHARES (1-800-474-2737).
GLD: Investing involves risk, and you could lose money on an investment in SPDR® Gold Trust (“GLD® ” or “GLD”). ETFs trade like stocks, are subject to investment risk, fluctuate in market value and may trade at prices above or below the ETF’s net asset value. Brokerage commissions and ETF expenses will reduce returns. Commodities and commodity-index-linked securities may be affected by changes in overall market movements, changes in interest rates and other factors such as weather, disease, embargoes, or political and regulatory developments, as well as trading activity of speculators and arbitrageurs in the underlying commodities. Frequent trading of ETFs could significantly increase commissions and other costs such that they may offset any savings from low fees or costs. Diversification does not ensure a profit or guarantee against loss. There can be no assurance that a liquid market will be maintained for ETF shares. Investing in commodities entails significant risk and is not appropriate for all investors. Important Information Relating to GLD: GLD has filed a registration statement (including a prospectus) with the Securities and Exchange Commission (“SEC”) for the offering to which this communication relates. Before you invest, you should read the prospectus in that registration statement and other documents GLD has filed with the SEC for more complete information about GLD and this offering. Please see the GLD prospectus for a detailed discussion of the risks of investing in GLD shares. When distributed electronically, the GLD prospectus is available by clicking here. You may get these documents for free by visiting EDGAR on the SEC website at sec.gov or by visiting spdrgoldshares.com. Alternatively, GLD or any authorized participant will arrange to send you the prospectus if you request it by calling 866.320.4053.

Global Head of Research
Christopher Gannatti began at WisdomTree as a Research Analyst in December 2010, working directly with Jeremy Schwartz, CFA®, Director of Research. In January of 2014, he was promoted to Associate Director of Research where he was responsible to lead different groups of analysts and strategists within the broader Research team at WisdomTree. In February of 2018, Christopher was promoted to Head of Research, Europe, where he was based out of WisdomTree’s London office and was responsible for the full WisdomTree research effort within the European market, as well as supporting the UCITs platform globally. In November 2021, Christopher was promoted to Global Head of Research, now responsible for numerous communications on investment strategy globally, particularly in the thematic equity space. Christopher came to WisdomTree from Lord Abbett, where he worked for four and a half years as a Regional Consultant. He received his MBA in Quantitative Finance, Accounting, and Economics from NYU’s Stern School of Business in 2010, and he received his bachelor’s degree from Colgate University in Economics in 2006. Christopher is a holder of the Chartered Financial Analyst Designation.

Global Chief Investment Officer
Jeremy Schwartz has served as our Global Chief Investment Officer since November 2021 and leads WisdomTree’s investment strategy team in the construction of WisdomTree’s equity Indexes, quantitative active strategies and multi-asset Model Portfolios. Jeremy joined WisdomTree in May 2005 as a Senior Analyst, adding Deputy Director of Research to his responsibilities in February 2007. He served as Director of Research from October 2008 to October 2018 and as Global Head of Research from November 2018 to November 2021. Before joining WisdomTree, he was a head research assistant for Professor Jeremy Siegel and, in 2022, became his co-author on the sixth edition of the book Stocks for the Long Run. Jeremy is also co-author of the Financial Analysts Journal paper “What Happened to the Original Stocks in the S&P 500?” He received his B.S. in economics from The Wharton School of the University of Pennsylvania and hosts the Wharton Business Radio program Behind the Markets on SiriusXM 132. Jeremy is a member of the CFA Society of Philadelphia.
