
GDMN
Efficient Gold Plus Gold Miners Strategy Fund

Published April 14, 2025

Global Head of Research
After a powerful run in 2023 and 2024—driven by artificial intelligence (AI) enthusiasm, resilient corporate earnings and liquidity tailwinds—the S&P 500 Index delivered returns that exceeded many expectations. But sitting in April 2025, with volatility re-entering the conversation in the wake of Trump's "Liberation Day"1 and an increasingly fractured macroeconomic landscape, investors are being forced to re-evaluate the risk-reward foundations of their portfolios.
The environment ahead looks different. Policy uncertainty is rising. Equity valuations have been falling, but it is difficult to consider appropriate market multiples with so much changing on the policy front. So, the next leg of the market cycle may be less about aligning with momentum and more about playing defense and diversification.
This is the precise situation where gold has been reasserting its relevance.
As an asset class, gold holds a unique psychological and strategic position—unlike anything else in the modern portfolio. It is not just another commodity; it's an anchor. A hedge. A store of value when confidence in fiat systems or global stability comes under pressure. And in 2025, with gold reaching all-time highs, seeming to settle at levels above $3,000 per Troy ounce,2 the investment case is no longer theoretical.
But investors face choices:
And now, a third option enters the arena—capital-efficient exposures that combine gold and gold miners into a single vehicle, such as the WisdomTree Efficient Gold Plus Gold Miners Strategy Fund (GDMN).5 These aim to deliver both the stability of the metal and the growth potential of the miners, while preserving portfolio capital to be deployed elsewhere.
As of April 9, 2025, the S&P 500 Index was down 6.9%, reminding investors that U.S. equities do not always go up. However, while this was happening, GLD appreciated 17.7%, GDX appreciated 32.0% and GDMN appreciated 45.1%.6
These different gold-sensitive exposures may be attracting a different degree of interest because of this contrast in returns relative to the S&P 500 benchmark.
Figures 1a and 1b look at returns over different time periods and horizons. The longest available period goes back to the inception of GDMN on December 16, 2021. Many might be surprised by the fact that GLD outperformed the S&P 500 Index (17.7% per year vs. 6.1% per year) from December 16, 2021, to April 9, 2025. We'd remind people that 2022 was characterized largely by inflation fighting and was a very difficult year for traditional asset classes.
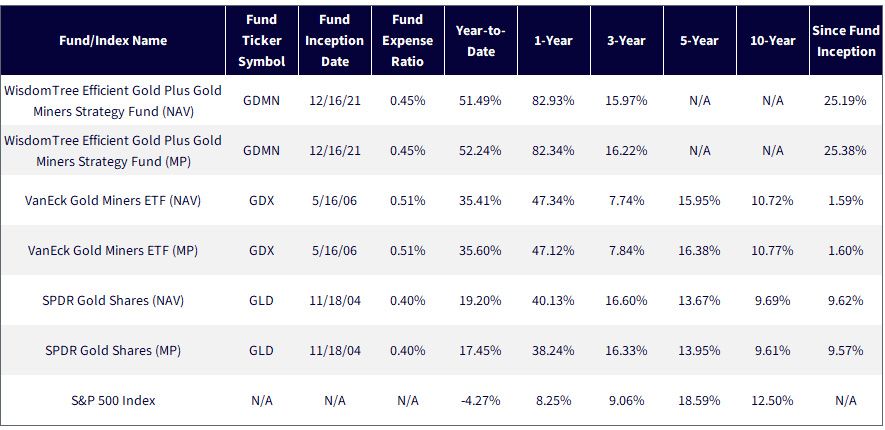
Sources: Morningstar, FactSet and WisdomTree, specifically data is from the PATH Fund Comparison Tool, accessed as of 4/10/25, but showing returns for the period ended 3/31/25. NAV denotes total return performance at net asset value. MP denotes market price performance. The performance data quoted represents past performance. Past performance is not indicative of future results. Investment return and principal value of an investment will fluctuate so that an investor's shares, when redeemed, may be worth more or less than their original cost. Current performance may be lower or higher than the performance data quoted. For the most recent month-end and standardized performance and to download the respective Fund prospectuses, click the relevant ticker: GDMN, GDX, GLD.
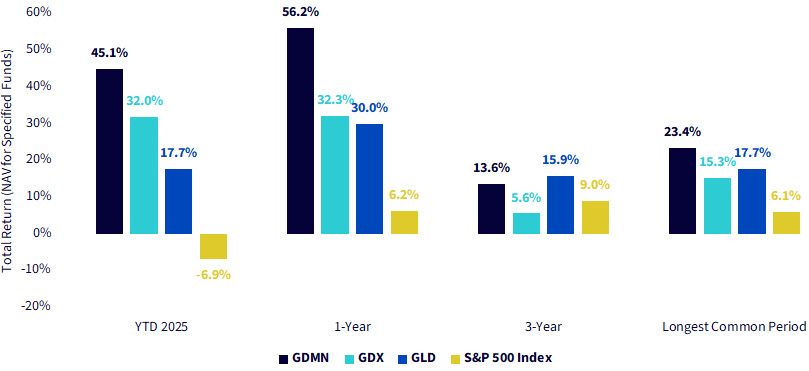
Sources: Morningstar, FactSet and WisdomTree, specifically data is from the PATH Fund Comparison Tool, accessed as of 4/10/25, but showing returns for the period ended 4/9/25. NAV denotes total return performance at net asset value. MP denotes market price performance. Longest Common period starts with 12/16/21, the inception date of GDMN. Past performance is not indicative of future results. Investment return and principal value of an investment will fluctuate so that an investor's shares, when redeemed, may be worth more or less than their original cost. Current performance may be lower or higher than the performance data quoted. For the most recent month-end and standardized performance and to download the respective Fund prospectuses, click the relevant ticker: GDMN, GDX, GLD.
As investors consider GDMN, GDX and GLD inside of the investment toolkit, a logical starting point regards the price of gold. Looking at GLD:
We can therefore go back over a number of years and use GLD's return to define calendar years in this way:
We already noted that many look at gold-mining equities as a way to create a more sensitive exposure to the price of gold, meaning a beta of greater than 1.0 relative to the price of gold could be expected.7 If gold's price is positive, this could mean outperformance, but similarly if gold's price is negative, this could mean underperforming and losing more in these environments.
Figures 2a and 2b go back to 2014, grouping years where GLD delivered a negative return (there were five) and years where GLD delivered a positive return (there were six).
GDMN was included in figure 2a, but we could not include it in the averages because it only began live calculation on December 16, 2021.
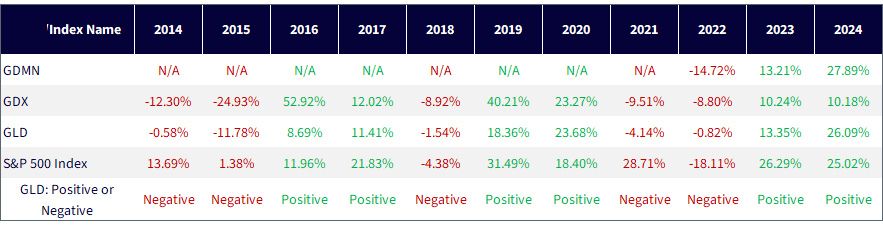
Sources: Morningstar, FactSet and WisdomTree, specifically data is from the PATH Fund Comparison Tool, accessed as of 4/6/25, but showing returns for the period ended 12/31/24, the most recent full year. NAV denotes total return performance at net asset value. MP denotes market price performance. Past performance is not indicative of future results. Investment return and principal value of an investment will fluctuate so that an investor's shares, when redeemed, may be worth more or less than their original cost. Current performance may be lower or higher than the performance data quoted. For the most recent month-end and standardized performance and to download the respective Fund prospectuses, click the relevant ticker: GDMN, GDX, GLD.
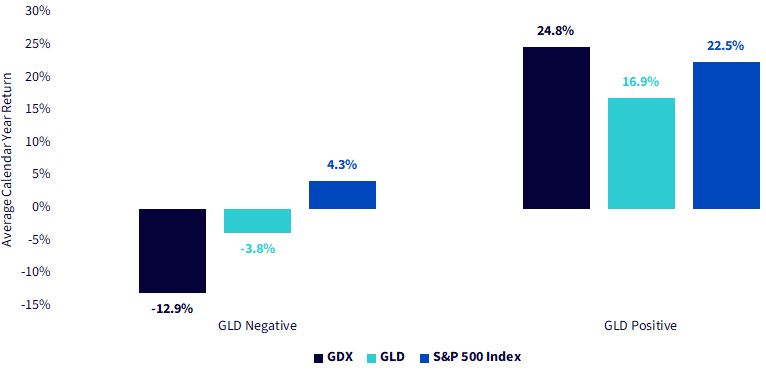
Sources: Morningstar, FactSet and WisdomTree, specifically data is from the PATH Fund Comparison Tool, accessed as of 4/6/25, but showing returns for the period ended 12/31/24, the most recent full year. NAV denotes total return performance at net asset value. MP denotes market price performance. Past performance is not indicative of future results. Investment return and principal value of an investment will fluctuate so that an investor's shares, when redeemed, may be worth more or less than their original cost. Current performance may be lower or higher than the performance data quoted. For the most recent month-end and standardized performance and to download the respective Fund prospectuses, click the relevant ticker: GDMN,GDX, GLD.
A more disciplined mergers and acquisitions (M&A) strategy among gold miners has supported a healthy balance sheet posture, enabling many miners to return capital to shareholders through dividends and aggressive share buyback programs, with Barrick Gold recently announcing such a new program.8 Barrick also announced improved financial performance despite higher costs, with an increase in net earnings of 69%—the highest in a decade—operating cash flow growth of 20% and a doubling of free cash flow relative to 2023.9 Newmont's free cash flow increased 115% from the prior quarter to $1.6 billion.10
These figures are especially notable considering that both companies have completed significant but measured transactions in recent years. For example:
Going forward, analysts expect this trend of selective, returns-focused M&A to continue,13 particularly as high-grade deposits become scarcer and organic exploration yields diminish. The most successful gold miners are likely to be those that combine disciplined deal-making with operational agility, rather than those that simply chase higher production volumes.
The sharp rise in gold prices through late 2024 and early 2025 has triggered a noticeable shift in industry behavior: a reinvigoration of exploration activity across the global mining sector. In January 2025 alone, gold-related exploration projects rose by 8%14—a figure that might appear modest in isolation but is highly significant when contextualized against the last decade of disciplined capital allocation and underinvestment in reserve replacement.
When investors turn to gold, what are they truly seeking? Is it a hedge against inflation, a store of value in times of uncertainty, a non-correlated asset for diversification or a tactical trade on macroeconomic dynamics? The answer depends on the investor—and increasingly, so do the options available to express that view.
Gold bullion, gold mining equities and capital-efficient gold strategies each offer distinct exposures, return profiles and risk characteristics. Some deliver purer alignment with the spot price of gold. Others introduce operational leverage, equity market sensitivity or sophisticated overlays designed to improve capital efficiency.
As forward-looking returns remain unknowable, the core challenge becomes not predicting gold's next move, but selecting the right vehicle that best maps to the investor's objective. In the age of proliferation and portfolio customization, gold-sensitive investing is no longer a binary decision. It's a design problem. There is no universal answer—only better alignment between tools and goals.
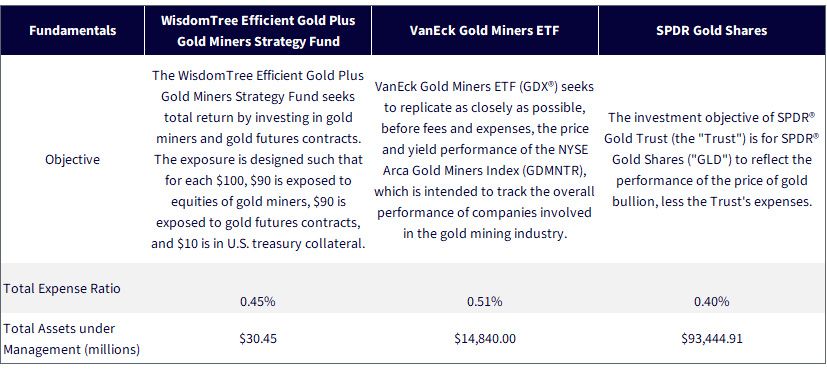
Sources: WisdomTree, VanEck and SPDR. Assets under management as of 4/2/25.
1 The Trump Administration called April 2, 2025's tariff announcements "Liberation Day."
2 Source: https://commodity.com/precious-metals/gold/price/
3 The investment objective of SPDR® Gold Trust (Trust) is for SPDR® Gold Shares (GLD") to reflect the performance of the price of gold bullion, less the Trust's expenses. It is the largest fund ranked by assets under management that provides exposure to movements in the price of physical gold.
4 VanEck Gold Miners ETF (GDX®) seeks to replicate as closely as possible, before fees and expenses, the price and yield performance of the NYSE Arca Gold Miners Index (GDMNTR), which is intended to track the overall performance of companies involved in the gold mining industry. It is the largest fund ranked by assets under management that provides exposure to movements in the share prices of a group of gold mining companies.
5 The WisdomTree Efficient Gold Plus Gold Miners Strategy Fund seeks total return by investing in gold miners and gold futures contracts. The exposure is designed such that for each $100, $90 is exposed to equities of gold miners, $90 is exposed to gold futures contracts and $10 is in U.S. Treasury collateral.
6 Shown in figure 1b as the Year-to-Date 2025 Return.
7 A beta of greater than 1.0 implies larger magnitude moves relative to a benchmark, such as if a benchmark was up (or down) 1.0%, then an asset with a beta of greater than 1.0 would have historically tended to move up (or down) by more than 1.0%.
8 Source: https://www.barrick.com/English/news/news-details/2025/barrick-announces-new-share-buyback-program/default.aspx
9 Source: https://www.barrick.com/English/news/news-details/2025/future-focused-barrick-sets-sights-on-30-percent-production-growth-by-2030/default.aspx
10 Source: https://www.newmont.com/investors/news-release/news-details/2025/Newmont-Reports-Fourth-Quarter-and-Full-Year-2024-Results-Provides-Full-Year-2025-Guidance/default.aspx
11 Source: https://www.barrick.com/English/news/news-details/2018/Barrick-and-Randgold-Combine-to-Create-Industry-Leading-Gold-Investment-Vehicle/default.aspx
12 https://www.newmont.com/investors/news-release/news-details/2023/Newmont-Acquires-Newcrest-Successfully-Creating-Worlds-Leading-Gold-Mining-Business/default.aspx
13 https://www.spglobal.com/market-intelligence/en/news-insights/research/mining-mna-in-2024-gold-dominates-mna-space-for-2nd-consecutive-year
14 Source: Sean DeCoff, "IM February 2025—Exploration Activity Rises," S&P Global, 2/27/25.
All funds are managed differently and do not react the same to economic or market events. The investment objectives, strategies, policies or restrictions of other funds may differ and more information can be found in their respective prospectuses. Therefore, we generally do not believe it is possible to make direct fund to fund comparisons in an effort to highlight the benefits of a fund versus another similarly managed fund.
GDMN: There are risks associated with investing, including the possible loss of principal. The Fund is actively managed and invests in U.S.-listed gold futures and global equity securities issued by companies that derive at least 50% of their revenue from the gold mining business (“gold miners”). The Fund’s use of U.S.-listed gold futures contracts will give rise to leverage, magnifying gains and losses and causing the Fund to be more volatile than if it had not been leveraged. Moreover, the price movements in gold and gold futures contracts may fluctuate quickly and dramatically and have a historically low correlation with the returns of the stock and bond markets. By investing in the equity securities of gold miners, the Fund may be susceptible to financial, economic, political or market events that impact the gold mining sub-industry, including commodity prices and the success of exploration projects. The Fund may invest a significant portion of its assets in the securities of companies of a single country or region, including emerging markets, and thus, the Fund is more likely to be impacted by events and political, economic or regulatory conditions affecting that country or region, or emerging markets generally. The Fund’s investment strategy will also require it to redeem shares for cash or to otherwise include cash as part of its redemption proceeds, which may cause the Fund to recognize capital gains. Please read the Fund’s prospectus for specific details regarding the Fund’s risk profile.
GDX: An investment in the Fund may be subject to risks which include, but are not limited to, risks related to investments in gold and silver mining companies, special risk considerations of investing in Australian and Canadian issuers, foreign securities, emerging market issuers, foreign currency, depositary receipts, small- and medium-capitalization companies, equity securities, market, operational, index tracking, authorized participant concentration, no guarantee of active trading market, trading issues, passive management, fund shares trading, premium/discount risk and liquidity of fund shares, non-diversified and index-related concentration risks, all of which may adversely affect the Fund. Emerging market issuers and foreign securities may be subject to securities markets, political and economic, investment and repatriation restrictions, different rules and regulations, less publicly available financial information, foreign currency and exchange rates, operational and settlement, and corporate and securities laws risks. Small- and medium-capitalization companies may be subject to elevated risks.
Investing involves substantial risk and high volatility, including the possible loss of principal. An investor should consider the investment objective, risks, charges and expenses of the Fund carefully before investing. To obtain a prospectus and summary prospectus, which contain this and other information, call 800.826.2333 or visit vaneck.com. Please read the prospectus and summary prospectus carefully before investing.
GLD: Investing involves risk, and you could lose money on an investment in GLD.
ETFs trade like stocks, are subject to investment risk, fluctuate in market value and may trade at prices above or below the ETF’s net asset value. Brokerage commissions and ETF expenses will reduce returns.
Commodities and commodity-index linked securities may be affected by changes in overall market movements, changes in interest rates and other factors such as weather, disease, embargoes, or political and regulatory developments, as well as the trading activity of speculators and arbitrageurs in the underlying commodities.
Frequent trading of ETFs could significantly increase commissions and other costs such that they may offset any savings from low fees or costs.
Diversification does not ensure a profit or guarantee against loss.
GLD has filed a registration statement (including a prospectus) with the Securities and Exchange Commission (“SEC”) for the offering to which this communication relates. Before you invest, you should read the prospectus in that registration statement and other documents GLD has filed with the SEC for more complete information about GLD and this offering. Please see the GLD prospectus for a detailed discussion of the risks of investing in GLD shares. You may get these documents for free by visiting EDGAR on the SEC website at sec.gov or by visiting spdrgoldshares.com. Alternatively, GLD or any authorized participant will arrange to send you the prospectus if you request it by calling 866.320.4053.
The Marketing Agent for GLD, State Street Global Advisors Funds Distributors, LLC, is not affiliated with Foreside Fund Services, LLC, or WisdomTree, Inc.
Efficient Gold Plus Gold Miners Strategy Fund

Global Head of Research
Christopher Gannatti began at WisdomTree as a Research Analyst in December 2010, working directly with Jeremy Schwartz, CFA®, Director of Research. In January of 2014, he was promoted to Associate Director of Research where he was responsible to lead different groups of analysts and strategists within the broader Research team at WisdomTree. In February of 2018, Christopher was promoted to Head of Research, Europe, where he was based out of WisdomTree’s London office and was responsible for the full WisdomTree research effort within the European market, as well as supporting the UCITs platform globally. In November 2021, Christopher was promoted to Global Head of Research, now responsible for numerous communications on investment strategy globally, particularly in the thematic equity space. Christopher came to WisdomTree from Lord Abbett, where he worked for four and a half years as a Regional Consultant. He received his MBA in Quantitative Finance, Accounting, and Economics from NYU’s Stern School of Business in 2010, and he received his bachelor’s degree from Colgate University in Economics in 2006. Christopher is a holder of the Chartered Financial Analyst Designation.

