WTV
U.S. Value Fund

Published December 3, 2024

Global Head of Research
Listen to the blog post below:
As investors prepare for the incoming Trump administration, they might be looking to refresh exposures for positions that might benefit from shifting policies, be it trade-, regulatory- or tax-related.
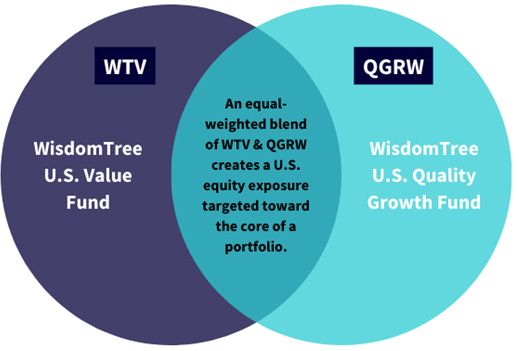
In this article, we explore a complementary 50/50 U.S. equity portfolio combination that includes a large-cap growth ETF with a well-diversified value strategy aiming to enhance core exposures.
To create the 50/50 core blend, we look to two specific WisdomTree strategies:
The combination of these two strategies, as visually represented in figure 1, leads to a strong balance of sector exposures, attractive fundamental metrics and, while limited, a nice performance history, which is demonstrated in the standardized performance shown in figure 2.
Source: WisdomTree.
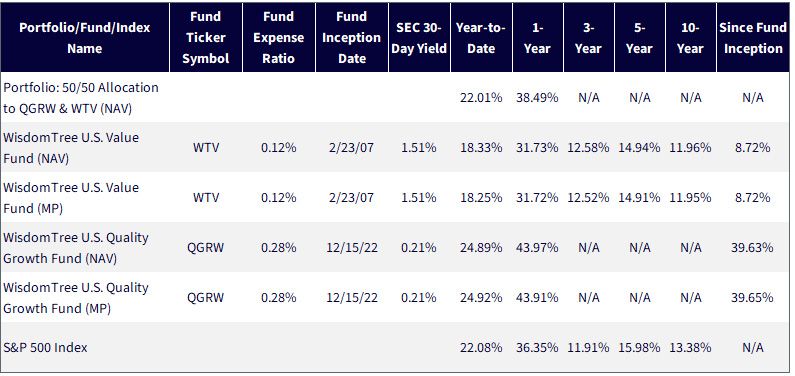
Source: WisdomTree, specifically data from the Fund Comparison Tool in the PATH suite of tools as of 9/30/24. SEC 30-Day Yield as of November 22, 2024. NAV denotes total return performance at net asset value. MP denotes market price performance. In the case of WTV, the Fund’s objective changed effective December 18, 2017. Prior to December 18, 2017, Fund performance reflects the investment objective of the Fund when it tracked the performance, before fees and expenses, of the WisdomTree U.S. LargeCap Value Index. Past performance is not indicative of future results. Investment return and principal value of an investment will fluctuate so that an investor’s shares, when redeemed, may be worth more or less than their original cost. Current performance may be lower or higher than the performance data quoted. For the most recent month-end and standardized performances and to download the respective Fund prospectuses, click the relevant ticker: QGRW, WTV.
The U.S. equity market environment of 2024 has been very similar to that of 2023—putting more focus on larger companies has, for the most part, been the way to outperform the main benchmarks, such as the S&P 500 Index.
One drawback of simply following the momentum of large growth is that, ultimately, valuation matters. It may not drive the market downward in the near term, but long-term investors know risk builds as valuation multiples rise and set a higher hurdle to clear with each earnings report.
The 50/50 allocation to QGRW and WTV has managed to outperform the S&P 500 in 2024, as the cumulative returns show in figure 3.
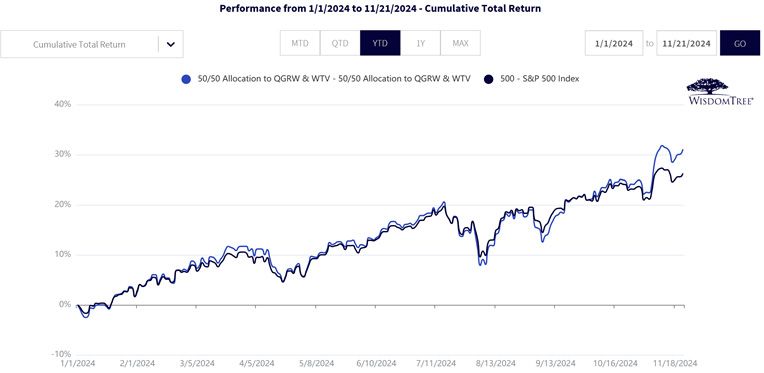
Source: WisdomTree, specifically data from the Fund Comparison Tool in the PATH suite of tools, accessed 11/22/24. NAV denotes total return performance at net asset value. MP denotes market price performance. Past performance is not indicative of future results. Investment return and principal value of an investment will fluctuate so that an investor’s shares, when redeemed, may be worth more or less than their original cost. Current performance may be lower or higher than the performance data quoted. For the most recent month-end and standardized performances and to download the respective Fund prospectuses, click the relevant ticker: QGRW, WTV.
In figure 4, we show that for rolling one-year periods, the 50/50 allocation to QGRW and WTV has outperformed the S&P 500 Index consistently since QGRW began trading in December 2022. Although it’s a limited history, what we do have so far looks consistent.
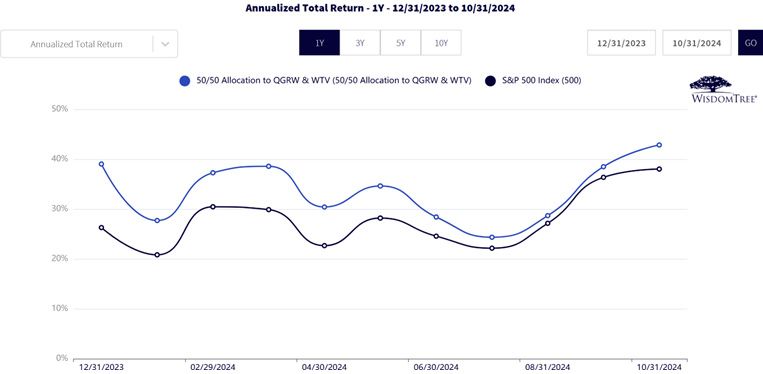
Source: WisdomTree, specifically data from the Fund Comparison Tool in the PATH suite of tools, accessed 11/22/24. NAV denotes total return performance at net asset value. MP denotes market price performance. Past performance is not indicative of future results. Investment return and principal value of an investment will fluctuate so that an investor’s shares, when redeemed, may be worth more or less than their original cost. Current performance may be lower or higher than the performance data quoted. For the most recent month-end and standardized performances and to download the respective Fund prospectuses, click the relevant ticker: QGRW, WTV.
The 50/50 WTV/QGRW combination delivered outperformance without being too “different” from the market from a sector perspective.
Figure 5 compares the sector exposures in the 50/50 QGRW/WTV portfolio versus the S&P 500 Index. There are subtle differences, but the 50/50 blend is not making massive sector bets versus the benchmark.
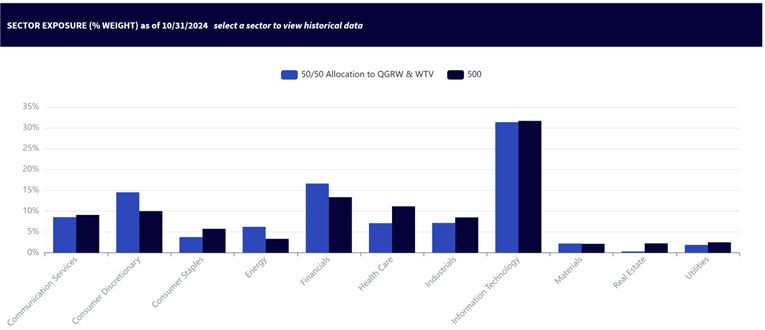
Source: WisdomTree, specifically data from the Fund Comparison Tool in the PATH suite of tools, accessed 11/22/24. Holdings subject to change.
The quote, “In the short run, the market is a voting machine, but in the long run, it is a weighing machine,” has been attributed to Benjamin Graham.
While we don’t know exactly when a shifting regime will occur, we do know that, ultimately, valuations matter and can weigh on future returns.
The 50/50 allocation to QGRW and WTV balances exposures to premier growth stocks with the WTV value component of the strategy to mitigate the risk of seeing valuation metrics run up too high versus the S&P 500 Index benchmark. The combination yields a portfolio with lower overall valuations than the market due to the deep discounts in WTV holdings, which can be seen in figure 6.
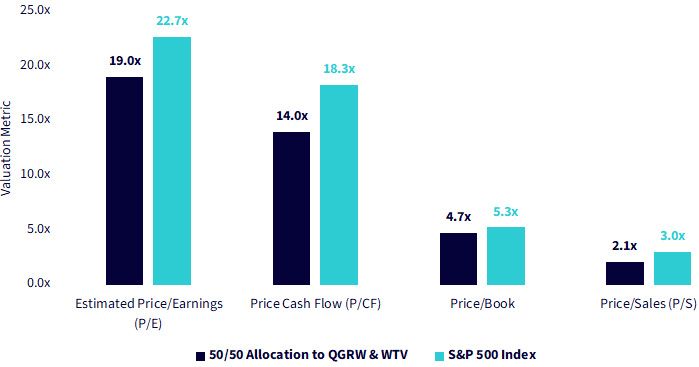
Source: WisdomTree, specifically data from the Fund Comparison Tool in the PATH suite of tools, accessed 11/22/24. For definitions of terms in the chart above, please visit the glossary.
Shareholder Yield as a Measure of Quality
One path unprofitable companies use to stay afloat is the issuance of equity during growth modes. Small stocks, such as those in the Russell 2000 Index, exemplify this.
Profitable companies, on the other hand, have a choice in returning cash to shareholders—some choose dividends, and others choose buybacks. In the U.S. market, a lot of the largest, most profitable companies like share buybacks because executives tend to have option-based compensation.
Buybacks are also much easier to think of on a one-time basis, whereas dividends culturally create a future unending covenant with shareholders.
WTV has a direct focus on companies that are reducing shares outstanding through buybacks. Figure 7 shows us that the 50/50 allocation to QGRW and WTV has a very similar dividend yield to the S&P 500 Index, but the share reduction yield is more than three times higher.
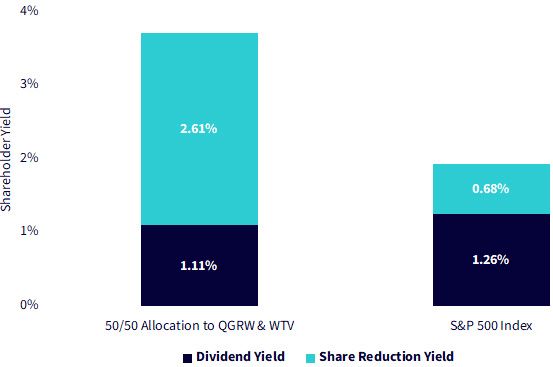
Source: WisdomTree, specifically data from the Fund Comparison Tool in the PATH suite of tools, accessed 11/22/24. Past performance is not indicative of future results. For definitions of terms in the chart above, please visit the glossary.
People connect with recognizable company names.
Figure 7 shows both the 50/50 allocation to QGRW and WTV and the S&P 500 Index have exposure to the Magnificent 7 stocks within the top 10 at similar weights.
Nine of the top 10 holdings are actually the same. AppLovin is the one stock the 50/50 blend brings into the top 10 relative to the S&P 500 Index, which instead has exposure to Berkshire, and this was because of very strong performance within WTV over the last year. These specific company exposures could change as the WisdomTree Funds rebalance in December, but our anticipation is that there will remain a high overlap.
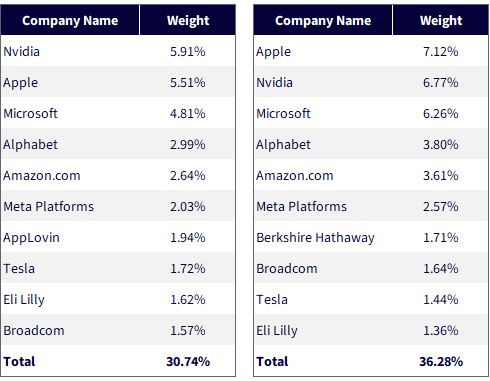
Source: WisdomTree, specifically data from the Fund Comparison Tool in the PATH suite of tools, accessed 11/22/24. Holdings subject to change.
As you look toward 2025 and wonder whether value or growth will have the potential to run, we’d simply note that the discussion can very easily shift to value and growth from value or growth. This combination created a better core, and we believe it has attractive characteristics to continue adding value.
For current holdings, please click the respective ticker: WTV, QGRW. Holdings are subject to risk and change.
To download the respective Fund prospectuses, please click the respective ticker: WTV, QGRW.
There are risks associated with investing, including the possible loss of principal. Please read the Fund’s prospectus for specific details regarding the Fund’s risk profile.
WTV: There are risks associated with investing, including the possible loss of principal. Funds focusing their investments on certain sectors increase their vulnerability to any single economic or regulatory development. This may result in greater share price volatility. While the Fund is actively managed, the Fund’s investment process is expected to be heavily dependent on quantitative models, and the models may not perform as intended.
QGRW: Growth stocks, as a group, may be out of favor with the market and underperform value stocks or the overall equity market. Growth stocks are generally more sensitive to market movements than other types of stocks. The Fund is non-diversified; as a result, changes in the market value of a single security could cause greater fluctuations in the value of Fund shares than would occur in a diversified fund. The Fund invests in the securities included in, or representative of, its Index regardless of their investment merit. The Fund does not attempt to outperform its Index or take defensive positions in declining markets, and the Index may not perform as intended.

Global Head of Research
Christopher Gannatti began at WisdomTree as a Research Analyst in December 2010, working directly with Jeremy Schwartz, CFA®, Director of Research. In January of 2014, he was promoted to Associate Director of Research where he was responsible to lead different groups of analysts and strategists within the broader Research team at WisdomTree. In February of 2018, Christopher was promoted to Head of Research, Europe, where he was based out of WisdomTree’s London office and was responsible for the full WisdomTree research effort within the European market, as well as supporting the UCITs platform globally. In November 2021, Christopher was promoted to Global Head of Research, now responsible for numerous communications on investment strategy globally, particularly in the thematic equity space. Christopher came to WisdomTree from Lord Abbett, where he worked for four and a half years as a Regional Consultant. He received his MBA in Quantitative Finance, Accounting, and Economics from NYU’s Stern School of Business in 2010, and he received his bachelor’s degree from Colgate University in Economics in 2006. Christopher is a holder of the Chartered Financial Analyst Designation.

