
QGRW
U.S. Quality Growth Fund

Published November 14, 2024

Global Head of Research
How many exchange-traded funds (ETFs) have roughly $300 billion in assets under management? Very, very few.
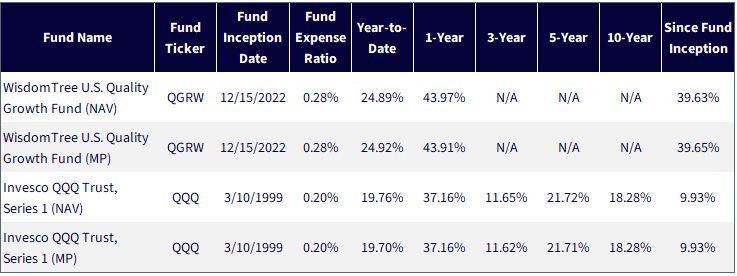
The Invesco QQQ Trust, Series 1 (QQQ), designed to track the total return performance, before fees, of the Nasdaq 100 Index, is one of them.1 Looking at figure 1, a key reason why is directly visible in the 10-year return as of September 30, 2024.
18.28%, annualized for 10 years, is an extremely strong number.
Sources: LSEG, FactSet and WisdomTree, specifically data is from the PATH Fund Comparison Tool, as of 9/30/24. NAV denotes total return performance at net asset value. MP denotes market price performance. Past performance is not indicative of future results. Investment return and principal value of an investment will fluctuate so that an investor’s shares, when redeemed, may be worth more or less than their original cost. Current performance may be lower or higher than the performance data quoted. For the most recent month-end and standardized performances, click the respective ticker: QGRW, QQQ.
In our opinion, the strongest strategies with the most assets under management have the potential to inspire the best competition.
Case in Point: the WisdomTree U.S. Quality Growth Fund (QGRW)
Not everyone realizes that the Nasdaq 100 Index is focused on the 100 largest non-financial companies listed on the Nasdaq exchange. Its methodology does not directly reference “growth” or “technology,” even if we might intuitively think of these things when we think of this benchmark in 2024.2
On the other hand, QGRW, designed to track the total return performance, before fees, of the WisdomTree U.S. Quality Growth Index, is specifically focused on some of the largest companies by market capitalization in the U.S. equity market that deliver strongly on both growth and quality metrics. Size or exchange listing alone does not denote the constituents.
As we write these words, it has been nearly two years since the world was introduced to ChatGPT. This application sparked a rally in what we now think of as the Magnificent 73—some of the largest companies by market capitalization in the world. These companies have significant exposures in the Nasdaq 100 Index, and they have contributed strongly to its recent performance.
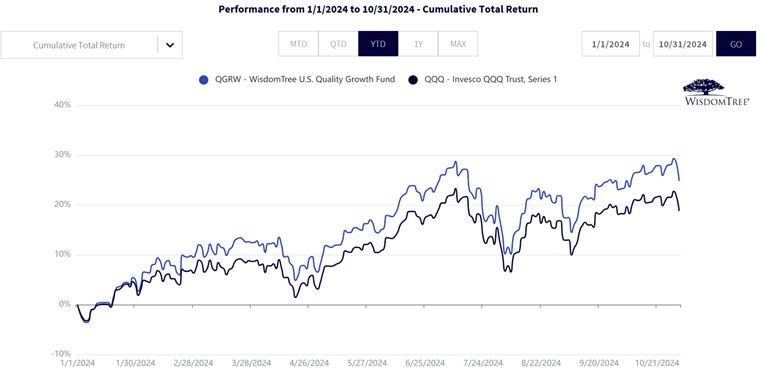
However, we can see in figure 2 that QGRW was able to outpace QQQ for the first 10 months of 2024.
Sources: LSEG, FactSet and WisdomTree, specifically data is from the PATH Fund Comparison Tool, as of 10/31/24. NAV denotes total return performance at net asset value. MP denotes market price performance. Past performance is not indicative of future results. Investment return and principal value of an investment will fluctuate so that an investor’s shares, when redeemed, may be worth more or less than their original cost. Current performance may be lower or higher than the performance data quoted. For the most recent month-end and standardized performances, click the respective ticker: QGRW, QQQ.
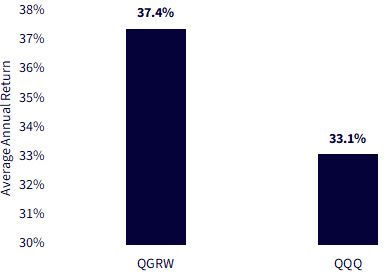
But QGRW's strength was not just a 2024 phenomenon. Figure 3 looks back at the full common period from December 14, 2022, through November 1, 2024.
We see roughly 430 basis points of annualized outperformance over QQQ.
Sources: LSEG, FactSet and WisdomTree, specifically data is from the PATH Fund Comparison Tool, as of 11/1/24. Period is from QGRW inception through 11/1/24. NAV denotes total return performance at net asset value. MP denotes market price performance. Past performance is not indicative of future results. Investment return and principal value of an investment will fluctuate so that an investor’s shares, when redeemed, may be worth more or less than their original cost. Current performance may be lower or higher than the performance data quoted. For the most recent month-end and standardized performances and to download the respective Fund prospectuses, click the respective ticker: QGRW, QQQ.
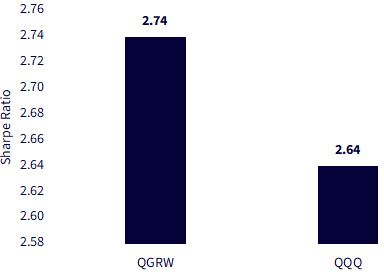
QGRW did exhibit, however, a higher standard deviation, so it makes sense to also look at the Sharpe ratio, a statistic that relates the return minus the risk-free rate divided by the standard deviation. A higher value indicates that a strategy’s risk-adjusted return is stronger, and in this case, QGRW is again the winner.
Sources: LSEG, FactSet and WisdomTree, specifically data is from the PATH Fund Comparison Tool, as of 11/1/24. Period is from QGRW inception through 11/1/24. NAV denotes total return performance at net asset value. MP denotes market price performance. Past performance is not indicative of future results. Investment return and principal value of an investment will fluctuate so that an investor’s shares, when redeemed, may be worth more or less than their original cost. Current performance may be lower or higher than the performance data quoted. For the most recent month-end and standardized performances and to download the respective Fund prospectuses, click the respective ticker: QGRW, QQQ.
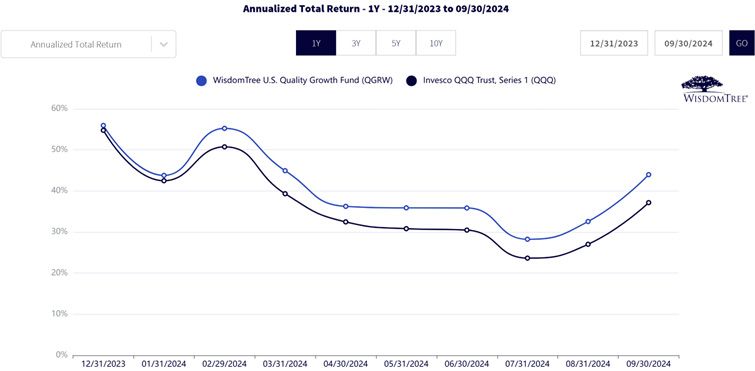
WisdomTree recently added a new functionality to its Fund Compare tool within the PATH suite of tools, which is the capability to look at rolling returns.
Looking at rolling 1-year returns in figure 5, QGRW has consistently outpaced QQQ. The more recent 1-year periods are showing a larger gap in favor of QGRW, but there is no guarantee that this will continue. Still, we note that this is happening during a period when the world’s focus is on the largest companies—many of which are well-represented within the Nasdaq 100 Index that QQQ is tracking.
Sources: LSEG, FactSet and WisdomTree, specifically data is from the PATH Fund Comparison Tool, as of 11/1/24. The rolling 1-year periods are calculated on a monthly basis, such that the starting date, 12/31/22, represents the first month-end after QGRW inception. NAV denotes total return performance at net asset value. MP denotes market price performance. Past performance is not indicative of future results. Investment return and principal value of an investment will fluctuate so that an investor’s shares, when redeemed, may be worth more or less than their original cost. Current performance may be lower or higher than the performance data quoted. For the most recent month-end and standardized performances, click the respective ticker: QGRW, QQQ.
It would be remarkable to design a strategy that will always outperform the Nasdaq 100 Index—we cannot claim to have done that. Future returns are always unknown.
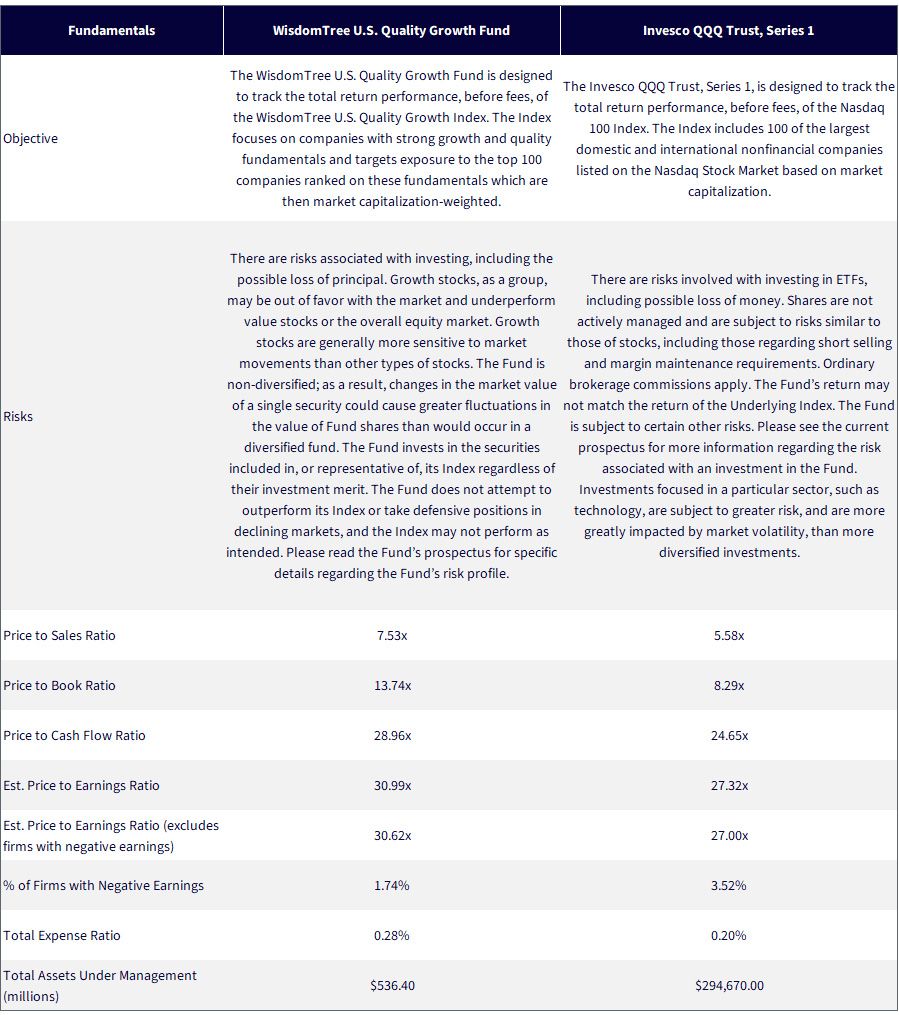
However, an index is designed to focus on particular areas. The WisdomTree U.S. Quality Growth Index is directly designed to measure the quality and growth characteristics of the underlying companies. The Nasdaq 100 Index is not directly measuring these things or using them to determine which companies to include and exclude.
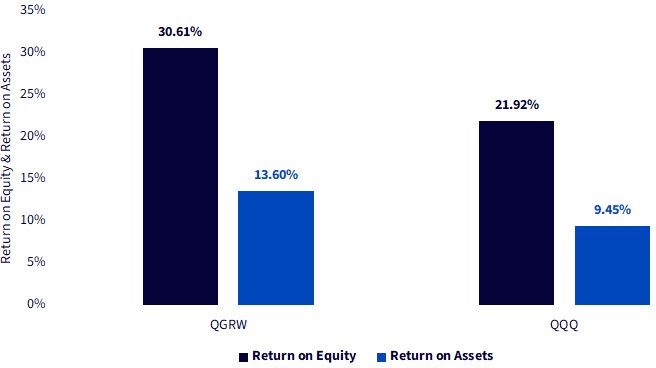
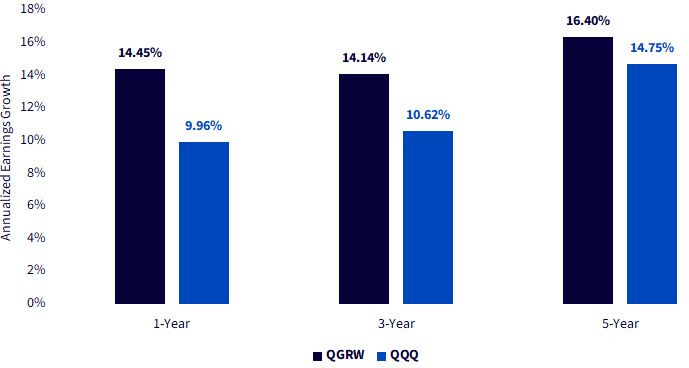
When we, therefore, look at figures 6 and 7, we can see that:
Again, these things do not automatically lead to “better returns” all of the time, but we’d note that many investors we speak to do appreciate what these statistics represent about the underlying basket of stocks.
Sources: LSEG, FactSet and WisdomTree, specifically data is from the PATH Fund Comparison Tool, as of 11/1/24.
Sources: LSEG, FactSet and WisdomTree, specifically data is from the PATH Fund Comparison Tool, as of 9/30/24.
Sources: LSEG, FactSet and WisdomTree; specifically, data is from the PATH Fund Comparison Tool, as of 9/30/24, except for the Total Assets Under Management, which is as of 11/1/24.
1 Source: Invesco’s website with general information on QQQ, available as of the November 1, 2024 market close.
2 Source: chrome-extension://efaidnbmnnnibpcajpcglclefindmkaj/https://indexes.nasdaqomx.com/docs/Methodology_NDX.pdf
3 The Magnificent 7 is a term coined to denote Alphabet, Amazon, Apple, Microsoft, Meta Platforms, Nvidia and Tesla.
There are risks associated with investing, including the possible loss of principal. Growth stocks, as a group, may be out of favor with the market and underperform value stocks or the overall equity market. Growth stocks are generally more sensitive to market movements than other types of stocks. The Fund is non-diversified; as a result, changes in the market value of a single security could cause greater fluctuations in the value of Fund shares than would occur in a diversified fund. The Fund invests in the securities included in, or representative of, its Index regardless of their investment merit. The Fund does not attempt to outperform its Index or take defensive positions in declining markets, and the Index may not perform as intended. Please read the Fund’s prospectus for specific details regarding the Fund’s risk profile.
U.S. Quality Growth Fund

Global Head of Research
Christopher Gannatti began at WisdomTree as a Research Analyst in December 2010, working directly with Jeremy Schwartz, CFA®, Director of Research. In January of 2014, he was promoted to Associate Director of Research where he was responsible to lead different groups of analysts and strategists within the broader Research team at WisdomTree. In February of 2018, Christopher was promoted to Head of Research, Europe, where he was based out of WisdomTree’s London office and was responsible for the full WisdomTree research effort within the European market, as well as supporting the UCITs platform globally. In November 2021, Christopher was promoted to Global Head of Research, now responsible for numerous communications on investment strategy globally, particularly in the thematic equity space. Christopher came to WisdomTree from Lord Abbett, where he worked for four and a half years as a Regional Consultant. He received his MBA in Quantitative Finance, Accounting, and Economics from NYU’s Stern School of Business in 2010, and he received his bachelor’s degree from Colgate University in Economics in 2006. Christopher is a holder of the Chartered Financial Analyst Designation.
