DGRW
U.S. Quality Dividend Growth Fund

Published November 24, 2025

Global Head of Research
The other day, I was thinking about the relatively high valuations of U.S. equities. It made me think of doing a review of different large exchange-traded funds (ETFs) across the U.S. large value category. We had also noticed Morningstar’s recent positioning of the WisdomTree U.S. Quality Dividend Growth Fund (DGRW) in their style box map, so we included it in the comparison.
When I start looking at strategies, I try to simplify the picture into three things:
We see the results in figure 1a.
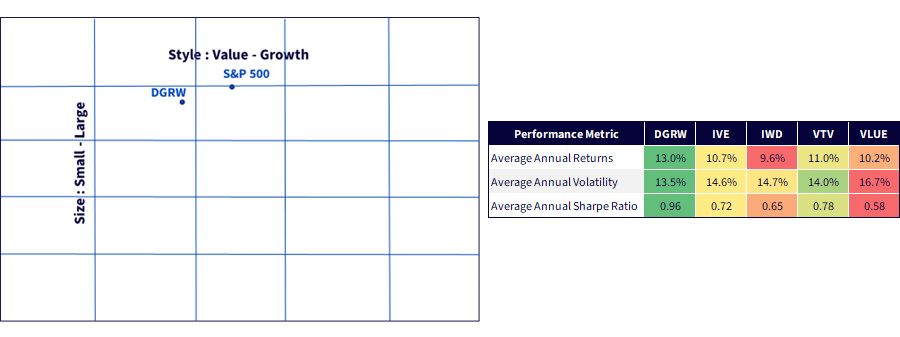
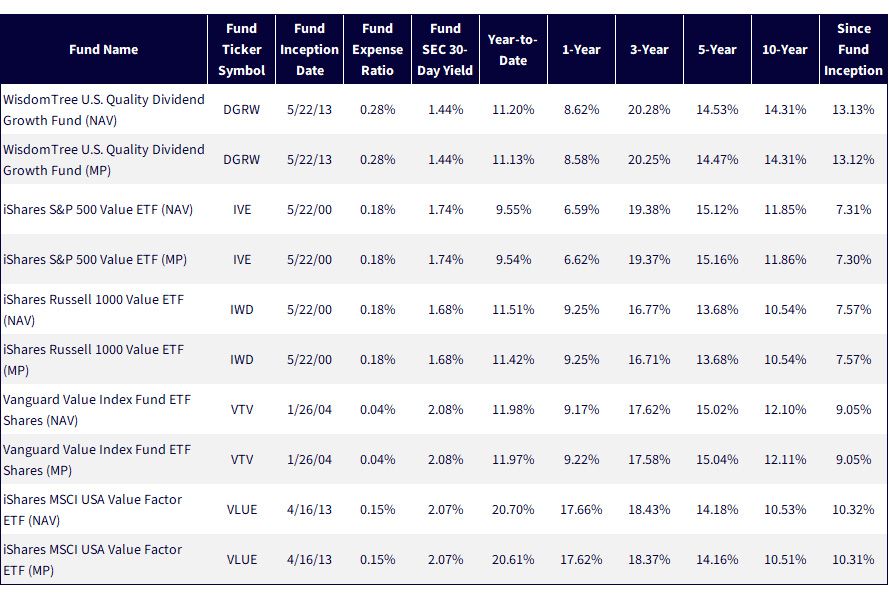
Sources: WisdomTree, FactSet, Morningstar, specifically data from the Fund Comparison Tool in the PATH suite of tools, accessed 11/3/25 with returns, volatility and Sharpe ratio as of 9/30/25. The period for these statistics starts as far back as possible for all strategies shown: 5/22/13, the inception date for DGRW. Morningstar style box is sourced from Morningstar, with data as of 10/31/25. NAV denotes total return performance at net asset value. MP denotes market price performance. Average Annual Return = The average amount an investment gained or lost each year over the period shown. Average Annual Volatility = A measure of how much an investment’s returns went up and down. Higher volatility means a bumpier ride. Sharpe Ratio = A way to compare investments by showing how much return you earned for each unit of risk taken. Higher numbers indicate better risk-adjusted performance. The performance data quoted represents past performance and is not indicative of future results. Investment return and principal value of an investment will fluctuate so that an investor’s shares, when redeemed, may be worth more or less than their original cost. Current performance may be lower or higher than the performance data quoted. For the most recent month-end and standardized performance, click the respective ticker: DGRW, IVE, IWD, VTV, VLUE.
To help with further context:
Of course, there are nuances to each of these approaches, but the overall focus is the same—predominantly large-cap stocks in the value style segment of the U.S. equity market.
Sources: WisdomTree, FactSet, specifically data from the Fund Comparison Tool in the PATH suite of tools, accessed 11/3/25 with returns, volatility and Sharpe ratio as of 9/30/25. NAV denotes total return performance at net asset value. MP denotes market price performance. The Morningstar Investment Style Box(TM) reveals a fund's investment strategy. For the equity holdings in the fund's portfolio, the vertical axis shows the market capitalization of the stocks owned and the horizontal axis shows investment style (value, blend or growth). The performance data quoted represents past performance and is not indicative of future results. Investment return and principal value of an investment will fluctuate so that an investor’s shares, when redeemed, may be worth more or less than their original cost. Current performance may be lower or higher than the performance data quoted. For the most recent month-end and standardized performance, click the respective ticker: DGRW, IVE, IWD, VTV, VLUE.
We recognize we don’t know what may or may not outperform going forward, but we do like the idea of owning the strongest businesses at reasonable prices as opposed to just the least expensive businesses overall. Inexpensive companies may represent opportunities, or they may represent value traps. DGRW, embedded in its process, seeks to measure the ROE and ROA of every underlying constituent, and includes only those with relatively higher figures. Even if, as we saw in figure 1a, DGRW screens into the U.S. large value segment of the Morningstar style box, the ROE and ROA metrics look markedly different.
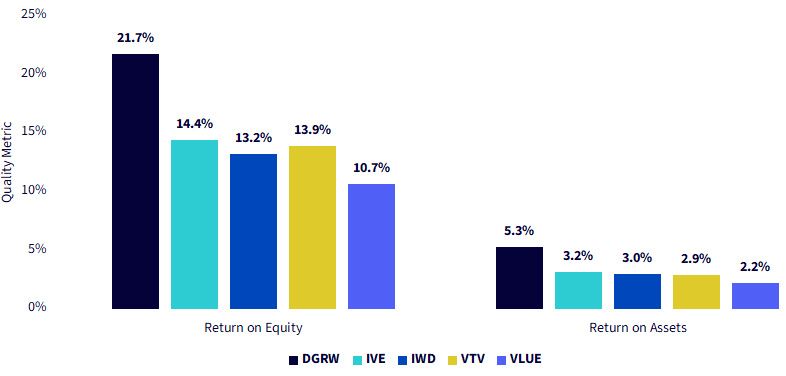
Sources: WisdomTree, FactSet, Morningstar, with data as of 9/30/25. Subject to change. Past performance is not indicative of future results.
We should all be honest about what leads us to think about valuation risk—we are concerned that the equity market may face a drawdown of some sort. In a drawdown, we know that anything can happen, but we prefer to have exposure to strong businesses with strong balance sheets and a proven capacity to generate earnings growth. While this guarantees nothing, it helps us to feel more prepared in case the unexpected happens.
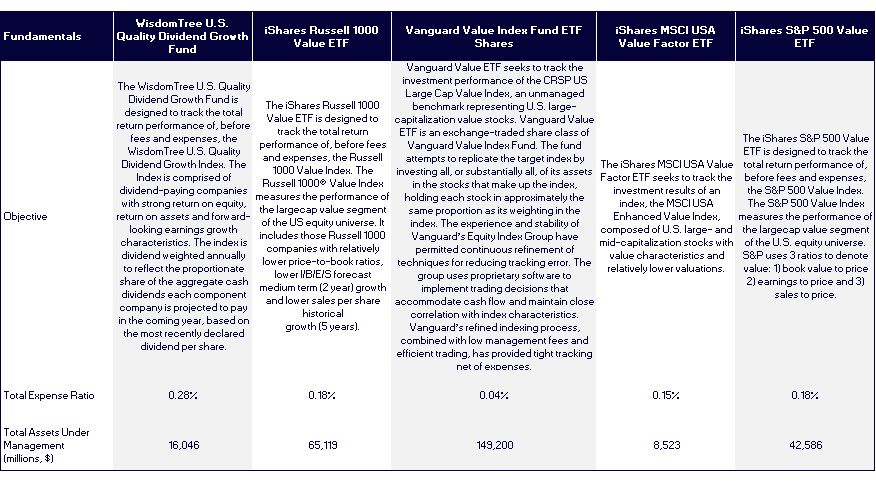
Sources: Fund sponsor websites and fund pages, with assets under management data current as of 10/31/25. All funds are managed differently and do not react the same to economic or market events. The investment objectives, strategies, policies or restrictions of other funds may differ and more information can be found in their respective prospectuses. Therefore, we generally do not believe it is possible to make direct fund to fund comparisons in an effort to highlight the benefits of a fund versus another similarly managed fund. Subject to change.
DGRW: There are risks associated with investing, including possible loss of principal. Funds focusing their investments on certain sectors increase their vulnerability to any single economic or regulatory development. This may result in greater share price volatility. Dividends are not guaranteed, and a company currently paying dividends may cease paying dividends at any time. Please read the Fund’s prospectus for specific details regarding the Fund’s risk profile.
IVE: There are risks involved with investing in ETFs, including possible loss of money. Shares are not actively managed and are subject to risks similar to those of stocks, including those regarding short selling and margin maintenance requirements. Ordinary brokerage commissions apply. The Fund's return may not match the return of the Underlying Index. The Fund is subject to certain other risks. Please see the current prospectus for more information regarding the risk associated with an investment in the Fund. Investments focused in a particular sector, such as technology, are subject to greater risk, and are more greatly impacted by market volatility, than more diversified investments.
VTV: There are risks involved with investing in ETFs, including possible loss of money. Shares are not actively managed and are subject to risks similar to those of stocks, including those regarding short selling and margin maintenance requirements. Ordinary brokerage commissions apply. The Fund's return may not match the return of the Underlying Index. The Fund is subject to certain other risks. Please see the current prospectus for more information regarding the risk associated with an investment in the Fund. Investments focused in a particular sector, such as technology, are subject to greater risk, and are more greatly impacted by market volatility, than more diversified investments.
VLUE: There are risks involved with investing in ETFs, including possible loss of money. Shares are not actively managed and are subject to risks similar to those of stocks, including those regarding short selling and margin maintenance requirements. Ordinary brokerage commissions apply. The Fund's return may not match the return of the Underlying Index. The Fund is subject to certain other risks. Please see the current prospectus for more information regarding the risk associated with an investment in the Fund. Investments focused in a particular sector, such as technology, are subject to greater risk, and are more greatly impacted by market volatility, than more diversified investments.
IVE: There are risks involved with investing in ETFs, including possible loss of money. Shares are not actively managed and are subject to risks similar to those of stocks, including those regarding short selling and margin maintenance requirements. Ordinary brokerage commissions apply. The Fund's return may not match the return of the Underlying Index. The Fund is subject to certain other risks. Please see the current prospectus for more information regarding the risk associated with an investment in the Fund. Investments focused in a particular sector, such as technology, are subject to greater risk, and are more greatly impacted by market volatility, than more diversified investments.
U.S. Quality Dividend Growth Fund

Global Head of Research
Christopher Gannatti began at WisdomTree as a Research Analyst in December 2010, working directly with Jeremy Schwartz, CFA®, Director of Research. In January of 2014, he was promoted to Associate Director of Research where he was responsible to lead different groups of analysts and strategists within the broader Research team at WisdomTree. In February of 2018, Christopher was promoted to Head of Research, Europe, where he was based out of WisdomTree’s London office and was responsible for the full WisdomTree research effort within the European market, as well as supporting the UCITs platform globally. In November 2021, Christopher was promoted to Global Head of Research, now responsible for numerous communications on investment strategy globally, particularly in the thematic equity space. Christopher came to WisdomTree from Lord Abbett, where he worked for four and a half years as a Regional Consultant. He received his MBA in Quantitative Finance, Accounting, and Economics from NYU’s Stern School of Business in 2010, and he received his bachelor’s degree from Colgate University in Economics in 2006. Christopher is a holder of the Chartered Financial Analyst Designation.

