


Paying the Right Price for the Right Business
Published October 30, 2025

Christopher Gannatti, CFA
Global Head of Research
Key Takeaways
- As 2025 unfolds with valuation pressures and concentrated mega-cap leadership, investors are reevaluating value strategies that prioritize durable earnings and disciplined capital allocation.
- While traditional value indexes have absorbed mega-cap tech names through statistical drift, the WisdomTree U.S. Quality Dividend Growth Fund (DGRW) seeks to offer a more intentional exposure by focusing on profitability, balance-sheet strength and dividend sustainability.
- DGRW illustrates that quality-focused value investing can deliver both resilience and compounding returns.
There are years when the word value takes on renewed gravity, and 2025 may well be one of them. As we progressed through the summer and into the fall, the S&P 500 Index has been hovering near record highs, led by a narrow group of mega-cap names whose profit margins and artificial intelligence (AI) narratives have created a rather spirited debate about valuation. Investors are once again asking whether the next leg higher requires something more grounded: earnings stability, dividends that compound over time and management teams that allocate capital with discipline rather than daring. In other words, the classic virtues of value investing may be coming back in focus, not as nostalgia, but as necessity.
Within this broad style, however, not all paths to "value" look the same. The S&P 500 Value Index and the Russell 1000 Value Index are the two most widely known of U.S. style benchmarking, but they reach their results through different engineering. The S&P methodology builds on six separate valuation and growth measures to divide each stock's market capitalization between the growth and value sides, aiming for balanced coverage of the full market.1 The Russell approach, by contrast, is probabilistic2, assigning companies to value or growth based on how strongly their financial characteristics tilt in one direction, using book-to-price, forward growth estimates and historical sales growth as key determinants.3 Both are broad, representative and, by design, "agnostic" to dividend behavior.
Then there's the WisdomTree's U.S. Quality Dividend Growth Index, a different expression of a large-cap value strategy altogether. Rather than beginning with valuation ratios, it starts with company fundamentals, profitability (return on equity and return on assets), earnings growth potential and how these relate to the potential to sustain and grow dividends. Companies must pass a coverage ratio screen ensuring earnings can comfortably support dividends, and the resulting portfolio is weighted by each firm's share of the U.S. Dividend Stream®, not by market cap. The outcome is a portfolio that Morningstar classifies as "U.S. Large Value,"4 yet its engine is quality and potential dividend durability rather than statistical cheapness. In a market environment where valuation extremes coexist with record cash generation, these three frameworks illustrate the spectrum of modern value investing, from the cheap to the balanced to the high-quality compounder.
Now, as we progress through this piece regarding the consequences of these different ways of achieving a U.S. large-value exposure, it's important to recognize:
- The WisdomTree U.S. Quality Dividend Growth Fund (DGRW) is designed to track the total return performance, before fees and expenses, of the WisdomTree U.S. Quality Dividend Growth Index.
- The iShares S&P 500 Value ETF (IVE) is designed to track the total return performance, before fees and expenses, of the S&P 500 Value Index.
- The iShares Russell 1000 Value ETF (IWD) is designed to track the total return performance, before fees and expenses, of the Russell 1000 Value Index.
It's important to connect the Indexes to their investable ETF counterparts.
How the Mag 7 Found Their Way into "Value,"and Why DGRW's Path May Bethe Clearest
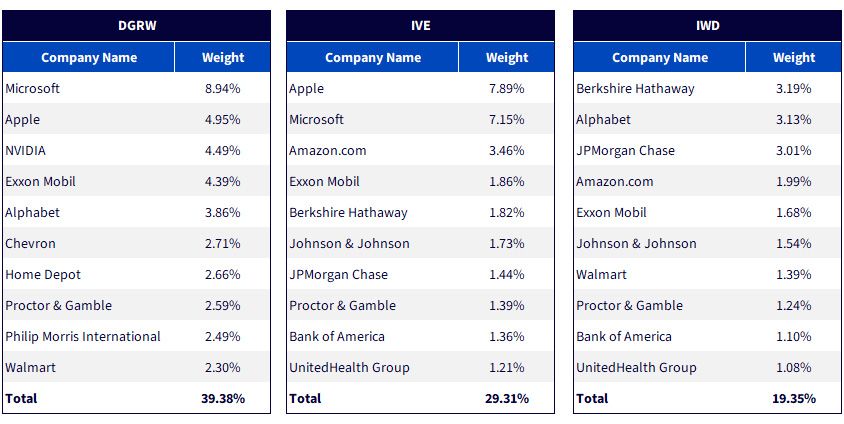
At first glance, it's surprising to see Apple topping the holdings of IVE or Alphabet and Amazon.com appearing inside IWD, Funds explicitly designed to represent value. Yet this is precisely what happens when traditional style methodologies rely on relative metrics. As growth stocks cool from extremes, their valuations look cheaper on a comparative basis, and Index frameworks like S&P's and Russell's mechanically reassign part of their market capitalization to the value side. The result: value indexes inherit exposure to the same mega-cap names that dominate core benchmarks, though for reasons tied more to statistical normalization than fundamental conviction. DGRW, by contrast, owns many of these same companies for an entirely different reason; its underlying index rules directly reward profitability, balance-sheet strength and potential dividend sustainability. In other words, it holds Microsoft, Apple or NVIDIA not because their multiples are compressed, but because their earnings power and capital discipline remain exceptional. That makes DGRW's exposure to the Mag 7 more transparent, intentional and, arguably, more aligned with how investors mean to express quality-tilted value in 2025.
Figure 1: Certain "Magnificent 7" Companies Are Finding Their Way into Value Strategies
Sources: WisdomTree, Morningstar and FactSet, with data from the Fund Comparison Tool and as of 9/30/25. Fund holdings are subject to change.
Where the Rubber Meets the Road: Performance
Ultimately, style distinctions and index methodologies matter because they drive performance outcomes: the part that investors and allocators actually feel. Theories about valuation, quality and dividend discipline become tangible when they translate into risk-adjusted returns, consistency through drawdowns and participation in market recoveries. This is where the "why" behind DGRW's design—its focus on profitability, sustainable dividends and disciplined growth—shows up in the "what" that investors experience. It's the point where frameworks give way to results: how well each strategy converts its definition of value into real-world compounding.
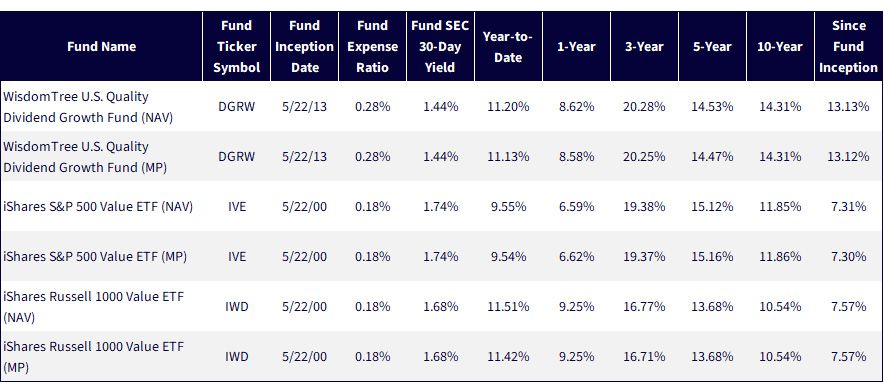
Figure 2: Standardized Performance
Sources: WisdomTree, FactSet, specifically data from the Fund Comparison Tool in the PATH suite of tools, accessed 10/20/25, with returns as of 9/30/25. NAV denotes total return performance at net asset value. MP denotes market price performance. Past performance is not indicative of future results. Investment return and principal value of an investment will fluctuate so that an investor's shares, when redeemed, may be worth more or less than their original cost. Current performance may be lower or higher than the performance data quoted. For the most recent month-end and standardized performances, click the relevant ticker: DGRW, IVE, IWD.
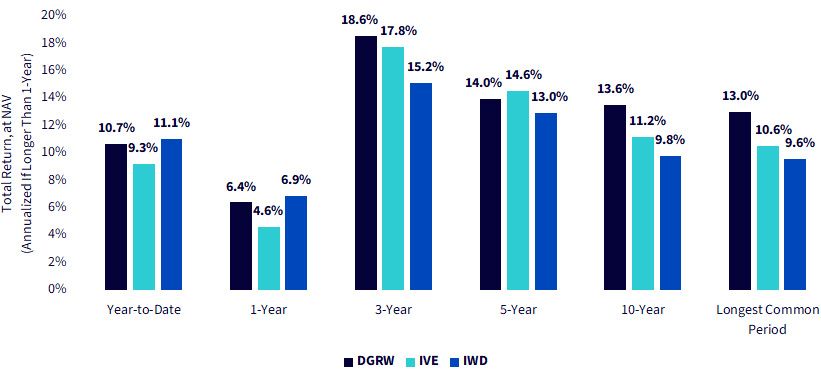
Across time horizons, the performance pattern reinforces the idea that quality and consistency can compound meaningfully over full market cycles. DGRW has not always been the absolute leader in every short-term window, but its steadier profile has delivered competitive or superior results across multi-year periods, particularly over five and ten years. Both IVE and IWD, the traditional value benchmarks, captured cyclical bursts when cheaper sectors rallied, yet their long-term averages have lagged. The takeaway is that emphasizing profitability, balance-sheet strength and dividend growth, rather than simply low valuation, has proven to be a durable formula for compounding returns through varying market regimes.
Figure 3: Breaking Down the Track Record
Sources: WisdomTree, FactSet, specifically data from the Fund Comparison Tool in the PATH suite of tools, accessed 10/20/25, with returns as of 10/17/25. Longest common period starts on DGRW's inception date, 5/22/13. NAV denotes total return performance at net asset value. MP denotes market price performance. Past performance is not indicative of future results. Investment return and principal value of an investment will fluctuate so that an investor's shares, when redeemed, may be worth more or less than their original cost. Current performance may be lower or higher than the performance data quoted. For the most recent month-end and standardized performances, click the relevant ticker: DGRW, IVE, IWD.
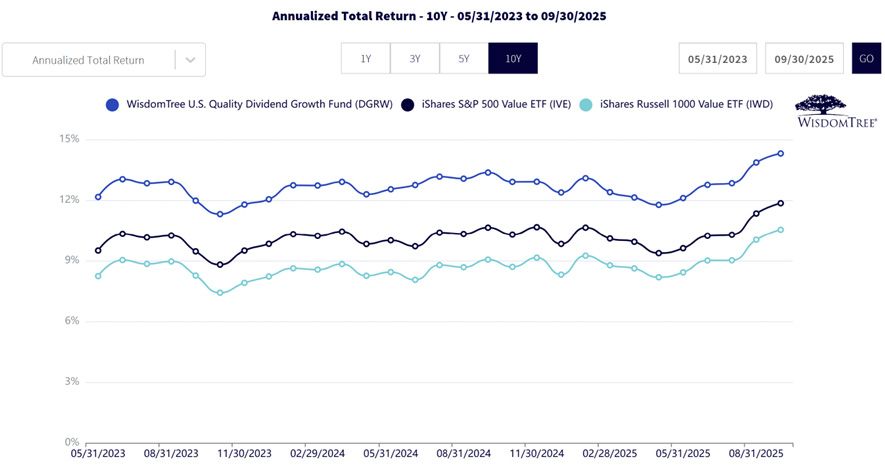
This chart is one of the clearest visual testaments to DGRW's long-term discipline. Over every rolling 10-year horizon since inception, the strategy has consistently outpaced both IVE and IWD, maintaining a steady performance premium that rarely wavers through market cycles. The smoothness of the gap underscores that the advantage isn't about timing or factor luck; it's the cumulative effect of owning profitable, capital-efficient companies that can sustain and grow their dividends through a variety of market environments. In a world where many value approaches work only in bursts, DGRW's persistence over full decades stands out as a defining feature.
Figure 4: Rolling 10-Year Annualized Returns
Sources: WisdomTree, FactSet, specifically data from the Fund Comparison Tool in the PATH suite of tools, accessed 10/20/25, with returns as of 9/30/25. Ten-year annualized returns are calculated monthly, starting from 5/31/13 to 5/31/23, which is the first full 10-year period. NAV denotes total return performance at net asset value. MP denotes market price performance. Past performance is not indicative of future results. Investment return and principal value of an investment will fluctuate so that an investor's shares, when redeemed, may be worth more or less than their original cost. Current performance may be lower or higher than the performance data quoted. For the most recent month-end and standardized performances, click the relevant ticker: DGRW, IVE, IWD.
Achieving Results without Taking Large Style or Size Bets
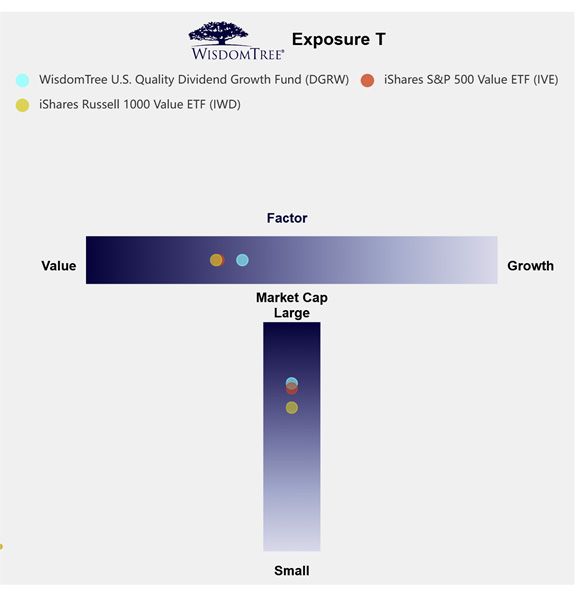
This illustration maps each strategy across two key dimensions, value versus growth on the horizontal axis and large versus small-market capitalization on the vertical. It helps visualize how "style" exposures differ beneath the surface. Many strategies that move away from pure market-cap weighting end up drifting lower on the size spectrum, leaning into smaller, more volatile stocks that historically offered higher long-term returns but greater risk. DGRWdoesn't take that route. Its position is only slightly less "value" and slightly more "large-cap" than traditional peers, reflecting its focus on profitable, dividend-growing leaders rather than deeper-value or smaller-cap names. In other words, DGRW's results aren't explained by a hidden size or style bet; they come from systematically emphasizing quality within the large-cap universe.
Figure 5: Targeting Exposures with WisdomTree's "T" Chart
Sources: WisdomTree, FactSet and Morningstar. Data as of 9/30/25, based on underlying Fund holdings. Fund holdings are subject to change. .
The Real Value Lies between Price and Quality
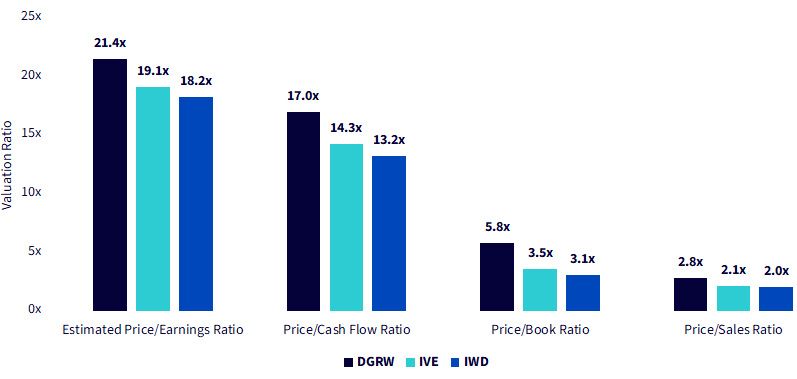
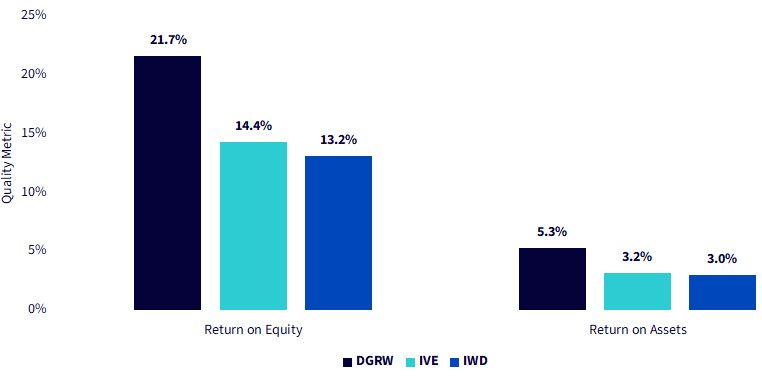
Figures 6a and 6b remind us that valuation and quality must always be read together. On their own, lower multiples might appear attractive, but without strong profitability and asset efficiency, "cheap" can quickly become a value trap. DGRWscreens somewhat more expensively than IVE or IWD, yet that premium aligns with meaningfully higher return on equity and return on assets, a signal that investors are paying for superior balance-sheet productivity and consistent earnings power. The narrative arc across these two charts is the essence of modern value investing: not choosing between cheap or high quality, but recognizing that sustainable value emerges where reasonable valuations meet durable, compounding businesses.
Figure 6a: Valuation Metrics
Sources: WisdomTree, FactSet and Morningstar. Data as of 9/30/25, based on underlying Fund holdings. Fund holdings are subject to change. For definitions of terms in the chart above, please visit the glossary.
Figure 6b: Quality Metrics
Sources: WisdomTree, FactSet and Morningstar. Data as of 9/30/25, based on underlying Fund holdings. Fund holdings are subject to change.
Conclusion:Redefining Value for the Next Decade
In a market where labels like "value" and "growth" blur with each new cycle, investors are best served by looking beyond style boxes to the underlying engines of return. The story across these comparisons is consistent: quality and discipline compound, while purely "cheap" exposures often come and go with the macro tide. DGRWshows that it's possible to stay valuation-aware without abandoning growth, to own durable franchises without drifting into small-cap risk and to translate that balance into measurable, persistent performance. In 2025, with markets near record highs and investors demanding both resilience and relevance, that blend of quality, growth and value isn't just a style; it's a strategy built for the long run.
Figure 7: Additional Information
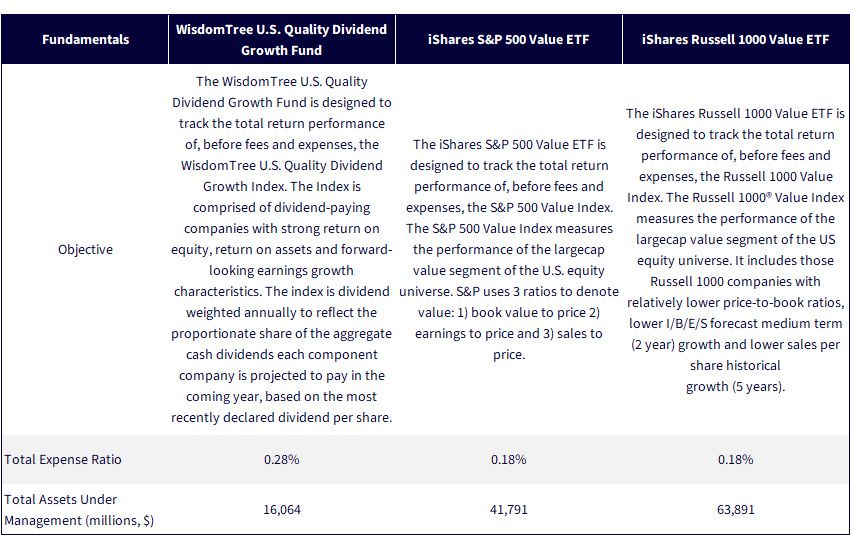
Sources: Respective WisdomTree & iShares Fund pages. Data for assets under management is as of 10/17/25. Subject to change. All funds are managed differently and do not react the same to economic or market events. The investment objectives, strategies, policies or restrictions of other funds may differ and more information can be found in their respective prospectuses. Therefore, we generally do not believe it is possible to make direct fund to fund comparisons in an effort to highlight the benefits of a fund versus another similarly managed fund.
1 Source: * S&P U.S. Style Indices Methodology * (Version 1.0). S&P Dow Jones Indices LLC, 10/25.
2 Probabilistic: based on or relating to how likely it is that something will happen.
3 Source: FTSE Russell, "Russell U.S. Equity Indexes: Construction and Methodology" (Version 6.8), London Stock Exchange Group plc, 8/25.
4 Source: "DGRW – WisdomTree U.S. Quality Dividend Growth ETF – Quote" [web page], Morningstar, Inc., 2025.
Important Risks Related to this Article
For current holdings of DGRW, please click here. Holdings are subject to risk and change.
DGRW: The WisdomTree U.S. Quality Dividend Growth Fund is designed to track the total return performance of, before fees and expenses, the WisdomTree U.S. Quality Dividend Growth Index. The Index is comprised of dividend-paying companies with strong return on equity, return on assets and forward-looking earnings growth characteristics. The index is dividend weighted annually to reflect the proportionate share of the aggregate cash dividends each component company is projected to pay in the coming year, based on the most recently declared dividend per share.
IVE: The iShares S&P 500 Value ETF is designed to track the total return performance of, before fees and expenses, the S&P 500 Value Index. The S&P 500 Value Index measures the performance of the largecap value segment of the U.S. equity universe. S&P uses 3 ratios to denote value: 1) book value to price 2) earnings to price and 3) sales to price.
IWD: The iShares Russell 1000 Value ETF is designed to track the total return performance of, before fees and expenses, the Russell 1000 Value Index. The Russell 1000® Value Index measures the performance of the largecap value segment of the US equity universe. It includes those Russell 1000 companies with relatively lower price-to-book ratios, lower I/B/E/S forecast medium term (2 year) growth and lower sales per share historical growth (5 years).

About the contributor

Christopher Gannatti, CFA
Global Head of Research
Christopher Gannatti began at WisdomTree as a Research Analyst in December 2010, working directly with Jeremy Schwartz, CFA®, Director of Research. In January of 2014, he was promoted to Associate Director of Research where he was responsible to lead different groups of analysts and strategists within the broader Research team at WisdomTree. In February of 2018, Christopher was promoted to Head of Research, Europe, where he was based out of WisdomTree’s London office and was responsible for the full WisdomTree research effort within the European market, as well as supporting the UCITs platform globally. In November 2021, Christopher was promoted to Global Head of Research, now responsible for numerous communications on investment strategy globally, particularly in the thematic equity space. Christopher came to WisdomTree from Lord Abbett, where he worked for four and a half years as a Regional Consultant. He received his MBA in Quantitative Finance, Accounting, and Economics from NYU’s Stern School of Business in 2010, and he received his bachelor’s degree from Colgate University in Economics in 2006. Christopher is a holder of the Chartered Financial Analyst Designation.