WTPI
Equity Premium Income Fund

Published April 7, 2025

Global Head of Research
Markets are storytellers, and the S&P 500 Index has told a few fascinating tales over the decades. Investors often view equities as a long-term compounding machine, but the reality is more nuanced. The U.S. stock market moves in distinct regimes—with some decades of explosive growth, others of stagnation or outright decline. These shifts aren't random; they reflect underlying economic forces, shifts in investor psychology and policy changes that alter the investing landscape.
Understanding these cycles isn't just an academic exercise; it's a framework for navigating markets. Some investors thrive in secular bull runs, while others find their edge in leaner times. Knowing where we stand can help shape expectations and strategies.
Let's examine five major market regimes over the past seven decades. Their narratives may rhyme with what we see today. In figure 1, we see:
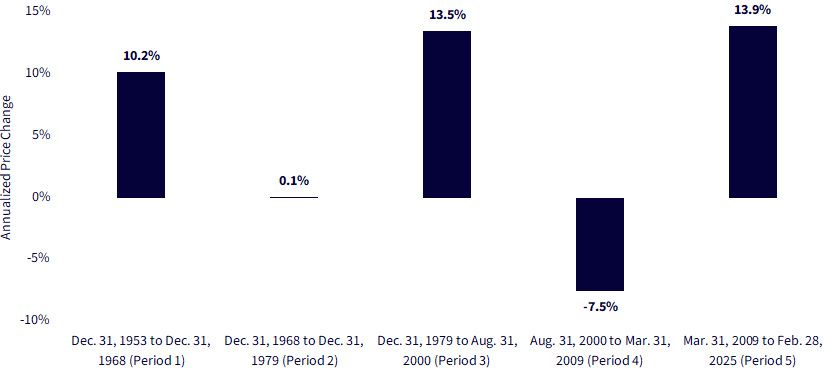
Source: http://www.econ.yale.edu/~shiller/data.htm. Percentage changes are based on the S&P 500 Index price level, not the total return. Past performance is not indicative of future results. You cannot invest directly in an index.
Annualized S&P 500 Price Change: +10.19%
Imagine the 1950s and 60s—new highways stretching across America, suburban expansion, manufacturing dominance. The war was over, and the economy was humming. Inflation was moderate, monetary policy was supportive and GDP growth was robust.
Equities reflected this economic vitality. A 10.19% annualized price appreciation over 15 years isn't just good—it's the kind of run that creates generational wealth. Stocks weren't just assets; they were participating in a national boom.
But markets, like economies, don't ascend in a straight line forever. By the late 1960s, cracks appeared. Inflation was creeping higher, and an era of easy growth was ending. What followed was a period that tested even the most patient investors.
Annualized S&P 500 Price Change: +0.11%
If the previous era was a dream, the 1970s were a slog. Inflation ran rampant, peaking above 10%,2 oil shocks rattled the economy and the Federal Reserve seemed trapped—tighten too much, and you trigger a recession; do too little, and inflation spirals.
The market went nowhere for over a decade. An annualized price change of 0.11% meant investors essentially treaded water, and that's before accounting for inflation. Real returns were brutal, accounting for double-digit inflation.
This was a lesson in valuation compression. Even as corporate earnings grew, P/E multiples shrank. It wasn't that companies weren't making money; it was that investors no longer wanted to pay up for those earnings.3
And then, in the late 70s, something changed. A new monetary regime was about to shake the system.
Annualized S&P 500 Price Change: +13.52%
Paul Volcker took charge of the Fed in 1979,4 and he wasn't there to make friends. Interest rates skyrocketed to break inflation's back, plunging the economy into recession. But once the medicine took effect, the stage was set for one of the greatest bull markets in history.
Deregulation, globalization, tax cuts—markets loved it. The 1980s and 90s produced an unprecedented run, culminating in the dot-com boom. The S&P 500 delivered an astonishing 13.52% annualized price appreciation over 21 years.
It felt unstoppable. But when things feel that way, history suggests they usually aren't.
Annualized S&P 500 Price Change: -7.55%
Markets work in cycles, and the late 90s exuberance had consequences. The dot-com bubble burst in 2000,5 and valuations came back to earth. Stocks struggled, bottoming in 2002 before recovering—only to be hit by an even greater storm: the global financial crisis.
From 2000 to 2009, the S&P 500 price level dropped -7.55% per year. Two major bear markets within a decade crushed investors' spirits. Passive investing, which had been bulletproof in the 80s and 90s, now seemed futile. Many capitulated, convinced that equities weren't the wealth-building machine they once thought.
And yet, history had one more surprise in store.
Annualized S&P 500 Price Change: +13.92%
The Federal Reserve responded to the 2008 crash with zero interest rates, quantitative easing and massive liquidity injections.6 The result? An historic bull market, driven by cheap money and a technology revolution.
Companies like Apple, Amazon and Google didn't just participate, they dominated. Their growth defined an era where scale, data and cloud computing became economic moats.
Even COVID-19, a once-in-a-century global shock, barely dented the market's trajectory. Liquidity found its way into assets, and stocks surged back at record speed.
By 2025, the question is clear: Is this era ending? Rising interest rates and a return to inflationary pressures suggest a regime shift may be near. If history is any guide, markets could look very different in the next decade.
Returning to the idea of passive investing, the S&P 500 has long been the cornerstone of global equity markets, and recent data shows just how much capital is tied to this iconic index. According to the latest S&P Dow Jones Indices Annual Survey of Assets, a staggering $16 trillion in assets is either benchmarked or indexed to the S&P 500 as of December 31, 2023.7
This marks a substantial increase from the $13.5 trillion reported in 20208 and an even more dramatic rise from $8.7 trillion in 2016.9 The growing reliance on the S&P 500 highlights not only its dominance in U.S. equities but also the continued rise of passive investing.
A closer look at the data reveals a clear trend: passive investing now outpaces active strategies in assets tracking the S&P 500. Of the $16 trillion tied to the index, $10 trillion is indexed (passively managed), while $6 trillion is benchmarked.10
This shift aligns with the broader industry trend favoring low-cost, rules-based investing, particularly through ETFs and index mutual funds. As more investors opt for passive strategies, the influence of the S&P 500 as the de facto barometer of U.S. equities continues to expand.
The history of the S&P 500 Index tells a story of stronger and weaker periods. Unfortunately, we have not yet found anything to allow us to predict the upcoming shifts with certainty. It's clear, however, that the critical ingredient is ensuring that one is ready the weather the tougher periods in order to be present for the stronger ones.
If investors are looking out at the sources of potential equity market risk in 2025 and thinking, "volatility could be heading upwards rather than downwards," then it's possible that a strategy designed to sell volatility, i.e., sell options, could be more attractive. The WisdomTree Equity Premium Income Fund (WTPI) has been generating some recent attention in this context.
1 Formally known as the WisdomTree PutWrite Strategy Fund (PUTW).
2 Source: https://www.federalreservehistory.org/essays/great-inflation
3 Source: https://www.valuescopeinc.com/resources/white-papers/the-sp-500-pe-ratio-a-historical-perspective/
4 Source: https://www.federalreservehistory.org/people/paul-a-volcker
5 Source: https://en.wikipedia.org/wiki/Dot-com_bubble
6 Source: https://www.federalreserve.gov/newsevents/speech/kohn20100513a.htm
7 Source: "S&P Dow Jones Indices Annual Survey of Assets," with data as of 12/31/23. This publication has historically come out in the summer period (June–July) of each year, and this is the most recent version available as of this writing.
8 Source: "S&P Dow Jones Indices Annual Survey of Assets," with data as of 12/31/20.
9 Source: "S&P Dow Jones Indices Annual Survey of Assets," with data as of 12/31/16.
10 Source: "S&P Dow Jones Indices Annual Survey of Assets," with data as of 12/31/23.
There are risks associated with investing, including possible loss of principal. The Fund will invest in derivatives, including S&P 500 Index put options (“SPX Puts”). Derivative investments can be volatile, and these investments may be less liquid than securities, and more sensitive to the effects of varied economic conditions. The value of the SPX Puts in which the Fund invests is partly based on the volatility used by market participants to price such options (i.e., implied volatility). The options values are partly based on the volatility used by dealers to price such options, so increases in the implied volatility of such options will cause the value of such options to increase, which will result in a corresponding increase in the liabilities of the Fund and a decrease in the Fund’s NAV. Options may be subject to volatile swings in price influenced by changes in the value of the underlying instrument. The potential return to the Fund is limited to the amount of option premiums it receives; however, the Fund can potentially lose up to the entire strike price of each option it sells. Due to the investment strategy of the Fund, it may make higher capital gain distributions than other ETFs. Please read the Fund’s prospectus for specific details regarding the Fund’s risk profile.
Equity Premium Income Fund

Global Head of Research
Christopher Gannatti began at WisdomTree as a Research Analyst in December 2010, working directly with Jeremy Schwartz, CFA®, Director of Research. In January of 2014, he was promoted to Associate Director of Research where he was responsible to lead different groups of analysts and strategists within the broader Research team at WisdomTree. In February of 2018, Christopher was promoted to Head of Research, Europe, where he was based out of WisdomTree’s London office and was responsible for the full WisdomTree research effort within the European market, as well as supporting the UCITs platform globally. In November 2021, Christopher was promoted to Global Head of Research, now responsible for numerous communications on investment strategy globally, particularly in the thematic equity space. Christopher came to WisdomTree from Lord Abbett, where he worked for four and a half years as a Regional Consultant. He received his MBA in Quantitative Finance, Accounting, and Economics from NYU’s Stern School of Business in 2010, and he received his bachelor’s degree from Colgate University in Economics in 2006. Christopher is a holder of the Chartered Financial Analyst Designation.

