


Slow…Curves Ahead
Published June 8, 2022

Kevin Flanagan
Head of Investment and Fixed Income Strategy
As the June FOMC meeting next week approaches, it’s been amazing to see how the narrative around monetary policy has shifted. Indeed, “40-year” inflationary pressures seem to be moving toward yesterday’s news, with the newfound concern revolving around where the U.S. economy may be headed. In other words, will Powell & Co. make a policy mistake in their inflation fight and potentially tip the economy from growth into a recession? Against this backdrop, investors often look to the Treasury (UST) yield curve for some answers.
Certainly, the recent performance of the UST 10-Year yield has underscored the uncertainty that has apparently gripped the bond market. After flirting with a reading of 2.70% as recently as a week or so ago, the 10-Year yield was right on the doorstep of the 3% threshold again following another solid jobs report.
Back to the yield curve. There are many versions of the yield curve to follow, with the UST 2s/10s spread being one of the more popular measures. As you may recall, this gauge went “inverted,” or into negative territory, for three short days in late March/early April, with the largest negative differential coming in at only -8 basis points (bps). As of this writing, the 2s/10s spread has moved back into the plus column to the tune of +30 bps. In fact, this spread has stabilized since going inverted, with an average reading of +27 bps over the last two months or so.
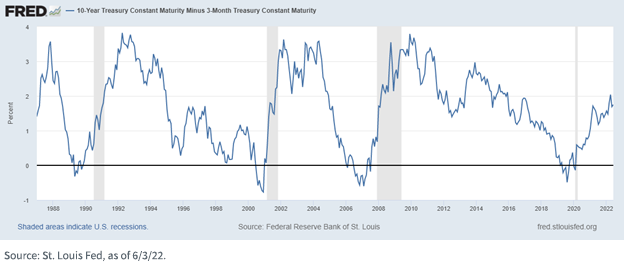
Another closely followed yield curve is the UST 3mo/10yr spread. Much like the aforementioned UST 2s/10s differential, this construct also has a very good track record as being a leading indicator of a recession following an inversion. However, the 3mo/10yr spread has not only not even come close to going negative this year; it has actually widened year-to-date by more than 30 bps. Admittedly, this curve has narrowed from its recent peak of 227 bps in early May, but it still remains about 10 bps above its long-term average of 166 bps.
Conclusion
With the Fed’s aggressive use of quantitative easing (QE), one needs to take a deeper look at yield curves before drawing the same conclusions from the historical past. In my opinion, there is little doubt that Fed purchases of longer-dated Treasuries, combined with safe-haven buying, have played a “distorting” role on the back-end of the curve and rendered a “fresh” look at yield curve analysis.
Perhaps the best way to think about it is that the yield curve may need to reveal a much more noteworthy inversion before signaling a recession could be on the way. Even if you don’t buy into this analysis, in the case of the UST 3mo/10yr curve, the negative spread reached as wide as -60 bps and -77 bps before the two recessions that came before the most recent COVID-19-related downturn. With the Fed poised to raise rates “expeditiously” to get to neutral territory, a flatter yield curve does seem likely going forward. However, using the UST 3mo/10yr spread’s current level of +177 bps, a huge amount of flattening would need to occur before sending off any recession signals.
Categories
Related articles
A ‘Warsh’ Out at the Fed

Fed Watch: The Changing of the Guard Finally Arrives
Private Credit Beyond the Headlines: Why Diversification and Liquidity Matter More Than Ever
Are Bessent’s Hands Tied?
‘Warsh’ and Dry

What’s ‘Under the Hood’ of Your Core Bond Position?

Powell Stays…Should the Dot Plot?

Fed Watch: Powell’s Last Stand & What Comes Next?
Inflation’s First Official Debut
About the contributor

Kevin Flanagan
Head of Investment and Fixed Income Strategy
Kevin serves as the Head of Investment and Fixed Income Strategy. In this role, he writes macro and fixed income-related content and works closely with the sales, research and marketing teams. In addition, Kevin conducts client-facing webinars and meetings, providing expertise on WisdomTree’s existing and future bond ETFs. Prior to joining WisdomTree, Kevin spent 30 years at Morgan Stanley, where he was Managing Director and Chief Fixed Income Strategist for Wealth Management. He was responsible for tactical and strategic recommendations and created asset allocation models for fixed income securities. He was a contributor to the Morgan Stanley Wealth Management Global Investment Committee, primary author of Morgan Stanley Wealth Management’s monthly and weekly fixed income publications, and collaborated with the firm’s Research and Consulting Group Divisions to build ETF and fund manager asset allocation models. Kevin has an MBA from Pace University’s Lubin Graduate School of Business, and a B.S. in Finance from Fairfield University.