


Is a 4% Treasury 10-Year Yield Possible?
Published June 22, 2022

Kevin Flanagan
Head of Investment and Fixed Income Strategy
With the Fed ramping up its rate hikes, investors are wondering where this will all end. Certainly, Powell & Co. have been moving the goalposts in that regard, with their latest dot plot revealing a median terminal Federal Funds Rate target of 3.80% in 2023, a full percentage point from what was estimated in March. This has become a moving target, which makes projecting where the U.S. Treasury (UST) 10-Year yield may end up a challenging endeavor.
While the overarching trend thus far in 2022 has been for the UST 10-Year yield to move to the upside, recent trading action has underscored the volatile nature of the bond market. After approaching 3.20% in early May, the 10-Year quickly reversed course and fell nearly 50 basis points (bps) toward the end of the month, to just above 2.70%. Then, last week investors witnessed a renewed surge northward, as the yield was knocking on the door of 3.50%.
U.S. 10-Year Fibonacci Chart
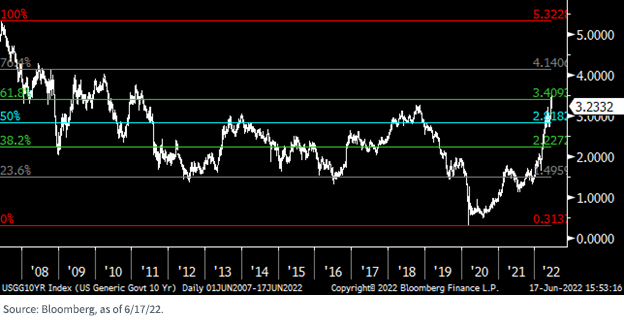
Naturally, the question remains whether a top has been reached. However, after looking at technical analysis, the rise in the UST 10-Year yield may not be over just yet. According to the closely followed Fibonacci retracement levels, this most recent move to the upside broke through the longer-term level of roughly 3.41%. As the enclosed graph reveals, there is now nothing between this aforementioned reading and the next retracement level of 4.14%.
Now, I’m not projecting that the 10-Year is about to break through the 4% barrier at this time. But the lack of any support levels before this threshold does create quite the conundrum. As we’ve discussed in some prior blog posts, watching developments from a real yield perspective could help determine where the nominal UST 10-Year yield could go as well. Thus far, it has worked quite well. During the current run-up of close to 3.50%, the 10-Year Treasury Inflation-Protected Securities (TIPS) yield surged by 75 bps, or nearly identical to the increase for the UST 10-Year. In fact, after being in the negative column as recently as late April, the 10-Year TIPS yield rose to as high as 0.83% before settling in at 0.64% as of this writing. Interestingly, this yield is still about 50 bps below the peak registered in 2018 during the last Fed rate hike cycle.
Conclusion
Barring a collapse in the economic data or a stock market meltdown, investors may look to the technicals and real yields for guidance on where that elusive top will be for the UST 10-Year yield. In my opinion, another test and potential overshoot of the 3.50% level seems distinctly possible.
Categories
Related articles
A ‘Warsh’ Out at the Fed

Fed Watch: The Changing of the Guard Finally Arrives
Private Credit Beyond the Headlines: Why Diversification and Liquidity Matter More Than Ever
Are Bessent’s Hands Tied?
‘Warsh’ and Dry

What’s ‘Under the Hood’ of Your Core Bond Position?

Powell Stays…Should the Dot Plot?

Fed Watch: Powell’s Last Stand & What Comes Next?
Inflation’s First Official Debut
About the contributor

Kevin Flanagan
Head of Investment and Fixed Income Strategy
Kevin serves as the Head of Investment and Fixed Income Strategy. In this role, he writes macro and fixed income-related content and works closely with the sales, research and marketing teams. In addition, Kevin conducts client-facing webinars and meetings, providing expertise on WisdomTree’s existing and future bond ETFs. Prior to joining WisdomTree, Kevin spent 30 years at Morgan Stanley, where he was Managing Director and Chief Fixed Income Strategist for Wealth Management. He was responsible for tactical and strategic recommendations and created asset allocation models for fixed income securities. He was a contributor to the Morgan Stanley Wealth Management Global Investment Committee, primary author of Morgan Stanley Wealth Management’s monthly and weekly fixed income publications, and collaborated with the firm’s Research and Consulting Group Divisions to build ETF and fund manager asset allocation models. Kevin has an MBA from Pace University’s Lubin Graduate School of Business, and a B.S. in Finance from Fairfield University.