WTV
U.S. Value Fund

Published August 25, 2025

Global Head of Research

Global Chief Investment Officer
If you're revisiting your equity portfolio in mid-2025, you're not alone. After a volatile first half of the year and continued macroeconomic crosscurrents—higher-for-longer rates, ongoing geopolitical fractures and renewed focus on capital discipline—investors globally are reassessing what they own, why and where.
Two indexes typically dominate the asset allocation conversation: the S&P 500 for U.S.-centric investors and the MSCI ACWI for those with a global orientation. But is there a more intentional—and potentially better-structured—way to frame a global equity portfolio today?
We think there is. One thoughtfully constructed blend we see merit in consists of:
Let's unpack why this 60/20/20 allocation that we'll call the "WT Global Value Portfolio," could be a compelling alternative to traditional benchmarks.
While the S&P 500 continues to be dominated by a handful of mega-cap growth names—the Magnificent 7 —WTV targets a differentiated slice of the U.S. market. It screens for shareholder yield through dividends and net buybacks, but crucially overlays quality and valuation filters.
WTV's portfolio has evolved since inception in 2017, but its north star remains constant: invest in companies returning capital to shareholders while avoiding valuation traps. As of mid-20252:
It's a value allocation that's not afraid to look different than more traditional value benchmarks. It actively tilts toward capital return and capital discipline, two traits the markets are rewarding again in a higher interest rate world.
Europe has long been the home of low valuations—but that alone isn't enough. What's changing in 2025 is the policy regime and fiscal direction.
OPPE combines traditional shareholder yield screens with a unique "GeoAlpha" overlay that targets themes leveraged to structural shifts, such as:
As of summer 2025, Europe trades at a 30%-plus valuation discount to the U.S.,3 even after the initial wave of re-rating in sectors tied to defense and energy security. OPPE targets the segment of the European market that's less expensive, more capital-disciplined and geopolitically relevant.
It's an allocation that asks: What if the new European economy is being rebuilt—and investors aren't paying attention?
Japan has gone from global value trap to global standout.
Behind the headlines of Warren Buffett buying into Japanese trading houses is a deeper transformation:
OPPJ is designed to capture this. Like its European cousin OPPE, it blends shareholder yield and governance screens with sectoral and thematic overlays. Think companies:
Put simply, OPPJ gives investors access to the Japan that's emerging—not the one fading from memory.
This 60/20/20 framework isn't about esoteric factor tilts or hyperactive tactical trades. It's about anchoring your global equity exposure in capital discipline, valuation realism and geopolitical alignment.
Compared to MSCI ACWI, the allocation is:
And compared to the S&P 500, it:
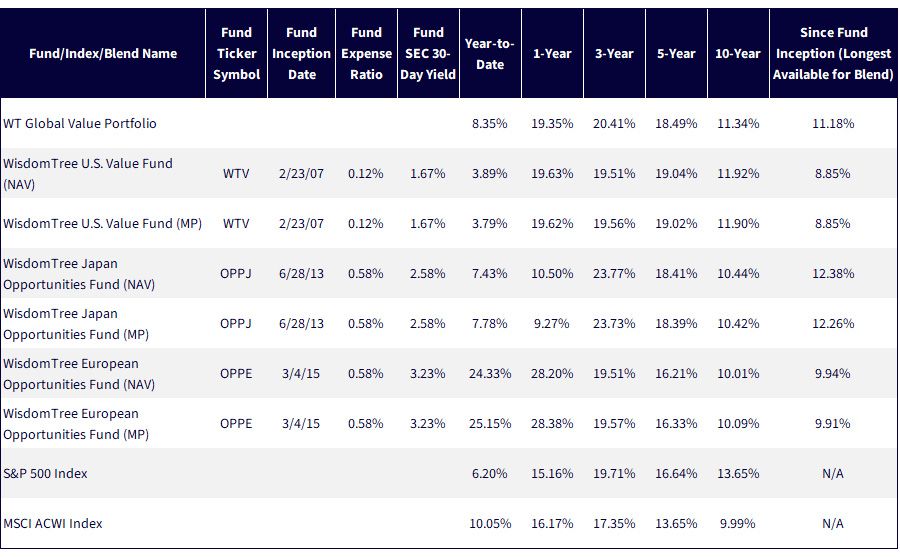
Sources: WisdomTree, FactSet, specifically data from the Fund Comparison Tool in the PATH suite of tools, accessed 7/25/25 with returns as of 6/30/25. NAV denotes total return performance at net asset value. MP denotes market price performance. WTV's objective changed effective 12/18/17. Prior to 12/18/17, Fund performance reflects the investment objective of the Fund when it tracked the performance, before fees and expenses, of the WisdomTree U.S. LargeCap Value Index. Prior to 7/1/25, OPPJ was known as the WisdomTree Japan Hedged SmallCap Equity Fund (DXJS). On that date, the Fund's investment policy changed. Prior to 6/2/25, OPPE was known as the WisdomTree Europe Hedged SmallCap Equity Fund (EUSC). On that date the Fund's investment policy changed. The performance data quoted represents past performance and is not indicative of future results. Investment return and principal value of an investment will fluctuate so that an investor's shares, when redeemed, may be worth more or less than their original cost. Current performance may be lower or higher than the performance data quoted. For the most recent month-end and standardized performance and to download the respective Fund prospectuses, click the relevant ticker: WTV, OPPJ, OPPE.
Figure 2 details the sector exposure story:
Figure 2: How the WT Global Value Portfolio Breaks from Sector Concentration
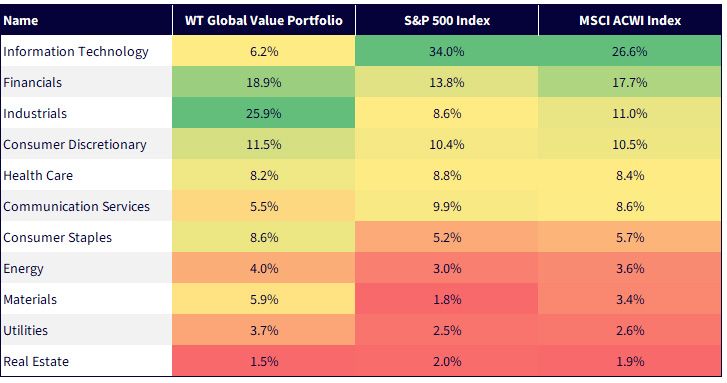
Sources: WisdomTree, FactSet, Morningstar, with data as of 7/31/25. Subject to change.
As we described WTV, OPPJ and OPPE, shareholder yield and a focus on capital discipline was mentioned in each case. Figure 3 indicates the actual total shareholder yield and how that compares to the benchmarks.
Figure 3: The Total Shareholder Yield Advantage
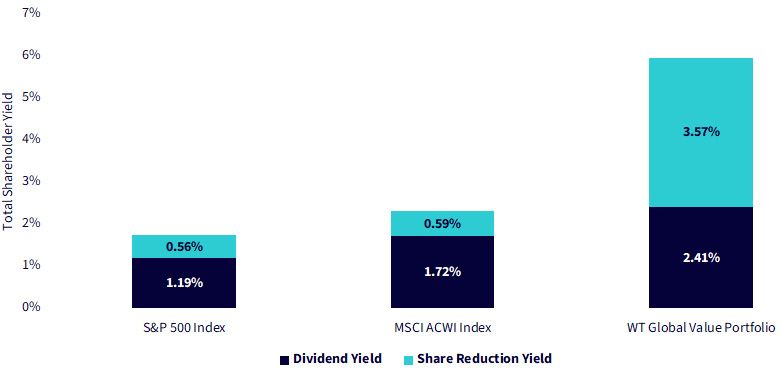
Sources: WisdomTree, FactSet, Morningstar, with data as of 7/31/25. Subject to change.
Speaking with many investors, a primary and often-cited concern is valuation. Figure 4 shows how, on an array of fundamental measures, the WisdomTree blend is mitigating this particular risk.
Figure 4: Leaning into Tomorrow's Potential, Not Yesterday's Winners

Sources: WisdomTree, FactSet, Morningstar, with data as of 7/31/25. Subject to change.
The 2010s were dominated by U.S. growth and low rates. The 2020s are shaping up to be something very different.
Investors who reframe their global allocations not as index completions, but as intentional exposures to capital return, restructuring and strategic autonomy, may be positioning themselves ahead of the curve.
This isn't just a portfolio—it's a statement about how global equity markets are changing, and how to adapt as an investor.
1 Refers to Itochu Corporation, Marubeni Corporation, Mitsubishi Corporation, Mitsui & Co., Ltd., Sumitomo Corporation. The source for these companies being mentioned as strategic holdings is Buffett, W. E. (2025, February 24). Berkshire Hathaway Inc. 2024 Annual Letter to Shareholders. Berkshire Hathaway Inc. https://www.berkshirehathaway.com/letters/2024ltr.pdf
2 Sources: WisdomTree, FactSet, with data as of 7/18/25.
3 Source: Refers to a comparison, as of 4/30/25, of the S&P 500 Index and the MSCI Europe Index on the basis of forward P/E ratio. Data is from WisdomTree, FactSet, S&P and MSCI.
4 Source: Japan Exchange Group, Inc., "Measures to Promote Management Awareness of Cost of Capital and Stock Price," Tokyo Stock Exchange, 3/31/23. https://www.jpx.co.jp/english/news/1020/e_20230331-01.html
5 Source: "Japan's Share Buybacks Nearly Triple as Governance Push Gains Pace," Financial Times, 5/1/25.
There are risks associated with investing, including the possible loss of principal. Funds focusing their investments on certain sectors increase their vulnerability to any single economic or regulatory development. This may result in greater share price volatility. While the Funds are actively managed, the Funds’ investment process is expected to be heavily dependent on quantitative models and the models may not perform as intended. Please read the Fund’s prospectus for specific details regarding the Funds’ risk profile.

Global Head of Research
Christopher Gannatti began at WisdomTree as a Research Analyst in December 2010, working directly with Jeremy Schwartz, CFA®, Director of Research. In January of 2014, he was promoted to Associate Director of Research where he was responsible to lead different groups of analysts and strategists within the broader Research team at WisdomTree. In February of 2018, Christopher was promoted to Head of Research, Europe, where he was based out of WisdomTree’s London office and was responsible for the full WisdomTree research effort within the European market, as well as supporting the UCITs platform globally. In November 2021, Christopher was promoted to Global Head of Research, now responsible for numerous communications on investment strategy globally, particularly in the thematic equity space. Christopher came to WisdomTree from Lord Abbett, where he worked for four and a half years as a Regional Consultant. He received his MBA in Quantitative Finance, Accounting, and Economics from NYU’s Stern School of Business in 2010, and he received his bachelor’s degree from Colgate University in Economics in 2006. Christopher is a holder of the Chartered Financial Analyst Designation.

Global Chief Investment Officer
Jeremy Schwartz has served as Global Chief Investment Officer since November 2021 and leads WisdomTree’s investment strategy team in the construction of WisdomTree’s equity Indexes, quantitative active strategies and multi-asset Model Portfolios. Jeremy joined WisdomTree in May 2005 as a Senior Analyst, adding Deputy Director of Research to his responsibilities in February 2007. He served as Director of Research from October 2008 to October 2018 and as Global Head of Research from November 2018 to November 2021. Before joining WisdomTree, he was a head research assistant for Professor Jeremy Siegel and, in 2022, became his co-author on the sixth edition of the book Stocks for the Long Run. Jeremy is also co-author of the Financial Analysts Journal paper “What Happened to the Original Stocks in the S&P 500?” He received his B.S. in economics from The Wharton School of the University of Pennsylvania and hosts the Behind the Markets podcast. Jeremy is a member of the CFA Society of Philadelphia.


