DLN
U.S. LargeCap Dividend Fund

Published December 9, 2025

Global Head of Research
Markets today are adjusting to a very different set of signals than they were just a year ago. The conversation has pivoted from stubbornly high interest rates and inflation fears to lowering rates, a steadily climbing gold price and persistent questions about U.S. fiscal sustainability. It is a cocktail that suggests investors are simultaneously seeking sources of potential safety, hedging against currency debasement and re-evaluating where durable equity returns can be found.
For value investors in U.S. large caps, this environment is both familiar and novel. Familiar because fiscal stress, rising government debt and the appeal of hard assets have historically coincided with renewed interest in companies that generate strong free cash flows and reward shareholders through dividends and buybacks.1 Novel because the traditional anchors of valuation—interest rates, inflation and credit conditions—are now moving in unusual directions at the same time. Lower rates may provide oxygen to growth stocks, but the flight to gold and mounting deficits remind us that investor confidence in endless borrowing is far from absolute.
This tension sharpens the lens through which the value style of investing is viewed. In a market where some of the most celebrated growth names remain priced for perfection, value-oriented large caps offer something different: tangible earnings power, balance sheet resilience and the potential to benefit if capital begins favoring cash over speculative promise. In other words, as investors hedge against fiscal fragility and monetary instability, value stands not as a defensive afterthought, but as an active strategy for navigating one of the most complex backdrops in years.
To evaluate the value investing style in U.S. large caps, we focus on two distinct yet complementary strategies: the WisdomTree U.S. LargeCap Dividend Fund (DLN) and the iShares Russell 1000 Value ETF (IWD). Both represent credible pathways to the large-cap value segment, but their construction and underlying philosophies differ in ways that can matter to investors.
DLN is built on the WisdomTree U.S. LargeCap Dividend Index. This Index selects the 300 largest U.S. dividend-payers by market capitalization and weights them not by price, but by the actual cash dividends they are expected to distribute over the coming year. The result is an approach that emphasizes income generation, balance sheet strength and the discipline of dividends as a screen for quality. It is explicitly fundamentally weighted, meaning companies paying out larger dividends command higher representation, irrespective of market hype or momentum.
IWD is one of the largest and most widely recognized ETFs in the value space, tracking the total return performance, before fees and expenses, of the Russell 1000 Value Index. The Russell 1000 Value captures the half of the Russell 1000® Index universe (the 1,000 largest U.S. companies) that scores higher on value factors such as lower price-to-book ratios, slower earnings growth and lower sales growth. It is market cap-weighted, meaning the largest companies by capitalization dominate exposure, regardless of dividend policy or payout behavior.2
We selected these two strategies because they represent different schools of thought within large-cap value investing:
Together, they create a natural lens for exploring how investors can access value: one through the cash flow discipline of dividends, and the other through the relative valuation lens of growth versus value style classification.
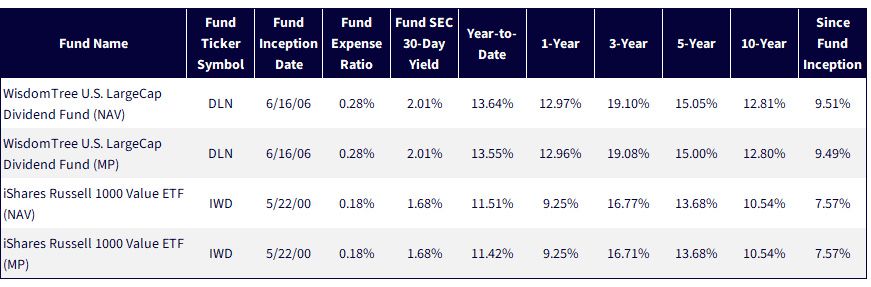
Sources: WisdomTree, FactSet, specifically data from the Fund Comparison Tool in the PATH suite of tools, accessed 11/26/25 with returns as of 9/30/25. NAV denotes total return performance at net asset value. MP denotes market price performance. Past performance is not indicative of future results. Investment return and principal value of an investment will fluctuate so that an investor's shares, when redeemed, may be worth more or less than their original cost. Current performance may be lower or higher than the performance data quoted. For the most recent month-end and standardized performance, click the relevant ticker: DLN, IWD.
Figure 2 brings across the bottom line, performance. To become interesting, the first thing that DLN must do is showcase competitive performance against the established large-cap value option.
Figure 2: Dividend Weighting vs. MarketCap in U.S. Large Value: Nearly Two Decades of Results
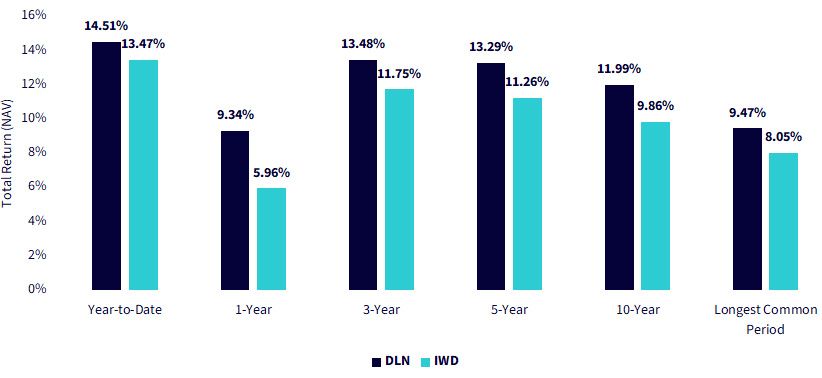
Sources: WisdomTree, FactSet, specifically data from the Fund Comparison Tool in the PATH suite of tools, accessed 11/26/25 with returns as of 11/25/25. NAV denotes total return performance at net asset value. Past performance is not indicative of future results. Investment return and principal value of an investment will fluctuate so that an investor's shares, when redeemed, may be worth more or less than their original cost. Current performance may be lower or higher than the performance data quoted. For the most recent month-end and standardized performance, click the relevant ticker: DLN, IWD.
When we shift from single-point returns to rolling 10-year periods, the conversation moves from outperformance to consistency. The chart shows that DLN has generally maintained a higher level of annualized returns than IWD, even as markets cycled through peaks, drawdowns and recoveries. Importantly, the dividend-weighted approach has tended to preserve its advantage across different environments—rising rates, falling rates and pandemic volatility alike. This reinforces the idea that the strategy's edge is not merely cyclical but embedded in the way it captures value over time.
Figure 3: Not Just Outperformance, but Endurance: Nearly Two Decades of Consistent Value
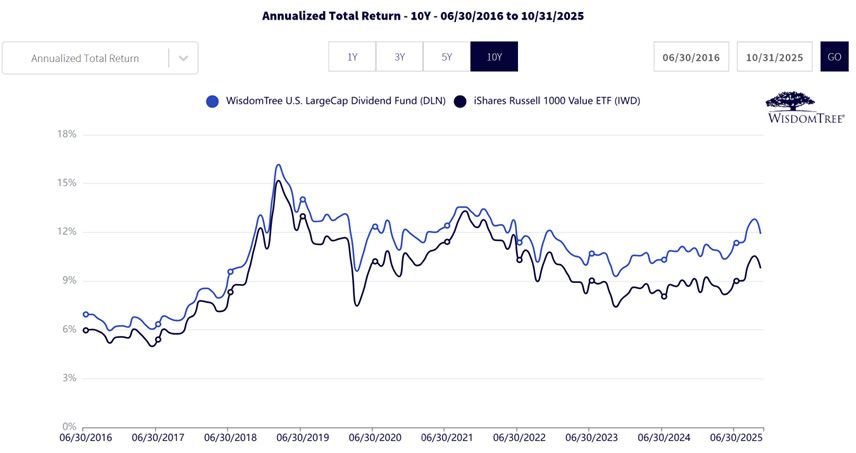
Sources: WisdomTree, FactSet, specifically data from the Fund Comparison Tool in the PATH suite of tools, accessed 11/26/25 with returns as of 10/31/25. Each month-end period represents the average annual total return for the 10-year period leading up to that date. As an example, 10/31/25 references the annualized return between 10/31/15 and 10/31/25. NAV denotes total return performance at net asset value. Past performance is not indicative of future results. Investment return and principal value of an investment will fluctuate so that an investor's shares, when redeemed, may be worth more or less than their original cost. Current performance may be lower or higher than the performance data quoted. For the most recent month-end and standardized performance, click the relevant ticker: DLN, IWD.
The Consequence of a Consistent DividendFocus
One of the clearest benefits of DLN's dividend-weighted methodology is revealed in the history of dividend yields. For nearly two decades, DLN has consistently delivered a higher dividend yield than IWD, a result of its focus on companies that pay dividends—and its larger allocation to those distributing more cash. While both funds move in tandem during market shocks, such as the yield spikes around the global financial crisis and the pandemic, DLN has maintained a persistent premium. This advantage is structural, not cyclical. It stems from the way the Index re-weights by forward-looking dividends rather than by market capitalization. For investors, the result is a more reliable stream of income, which can compound meaningfully over long time horizons and serve as an anchor in uncertain market environments.
Figure 4: Generating a Dividend-Yield Advantage over Time
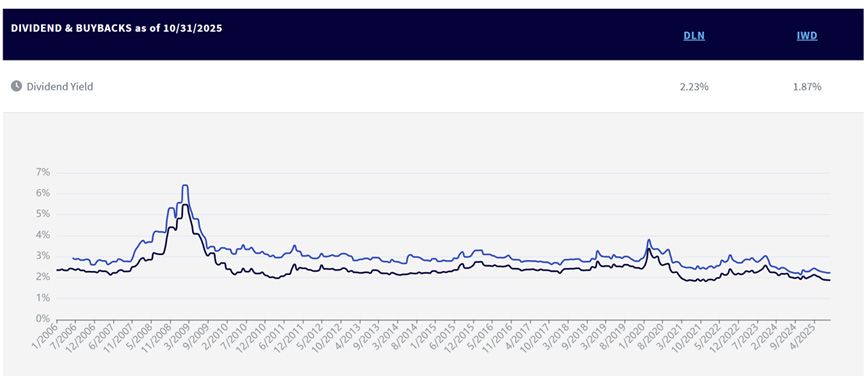
Sources: WisdomTree, FactSet, specifically data from the Fund Comparison Tool in the PATH suite of tools, accessed 11/26/25 with the period based on available data (June 2006–October 2025 for DLN; January 2006–October 2025 for IWD). Past performance is not indicative of future results.
Dividend weighting doesn't just affect sector tilts or aggregate yield, it reshapes the leadership of the portfolio at the company level. By requiring dividend payments as an entry ticket and then scaling weights by the cash actually returned to shareholders, DLN constructs a very different set of top holdings than a market cap-weighted index like IWD. The comparison of the two funds' top 10 names makes this clear, highlighting how dividend policy interacts with valuation to redefine what large-cap value looks like in practice.
In DLN's top 10, investors find the expected stalwarts in financials and energy, JPMorgan, Exxon Mobil, Chevron, but also names like Alphabet, Apple, Microsoft and Nvidia. These companies would rarely be considered "value" under traditional metrics, yet their initiation and growth of dividend programs push them into the dividend-weighted framework. On the other side, IWD includes Berkshire Hathaway and Amazon, firms that either don't pay dividends or have distinct capital allocation models, but which screen as value by book-to-price and growth measures. The presence of Alphabet in both lists underscores the contrast. One index requires dividends to gain entry, while the other emphasizes relative cheapness, showing how two definitions of "value" can generate strikingly different portfolios.
Figure 5: A Comparison of Top 10 Holdings
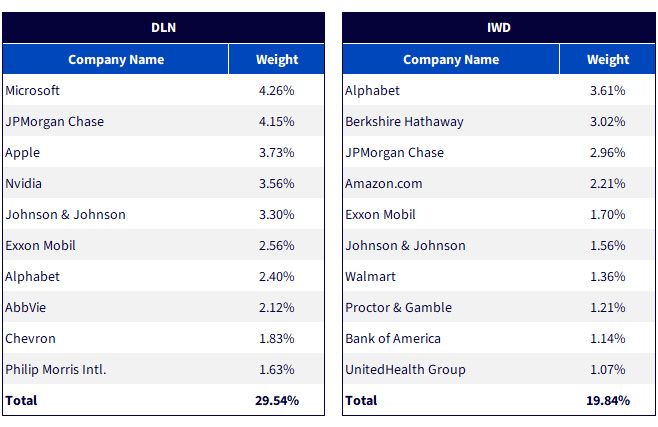
Sources: WisdomTree, FactSet, with data as of 10/31/25 from the Fund Comparison Tool in WisdomTree's PATH suite of tools, accessed 11/26/25. Subject to change.
Conclusion: Does a Focus on Dividends Risk Screening Out the Market?
With our PATH suite of tools (results shown in figure 6), we can measure how IWD has looked relative to DLN over the past 10 years. There are two primary points to bring home:
DLN's dividend focus tilted more weight to the two highest dividend-yielding quintiles of U.S. equity exposure.
IWD's average exposure to non-dividend-payers was around 12%, telling us that focusing on dividend-payers has not been a massive force in eliminating a lot of the market's exposure in the value space.
Figure 6: Gauging the Dividend Tilt of DLN vs. IWD
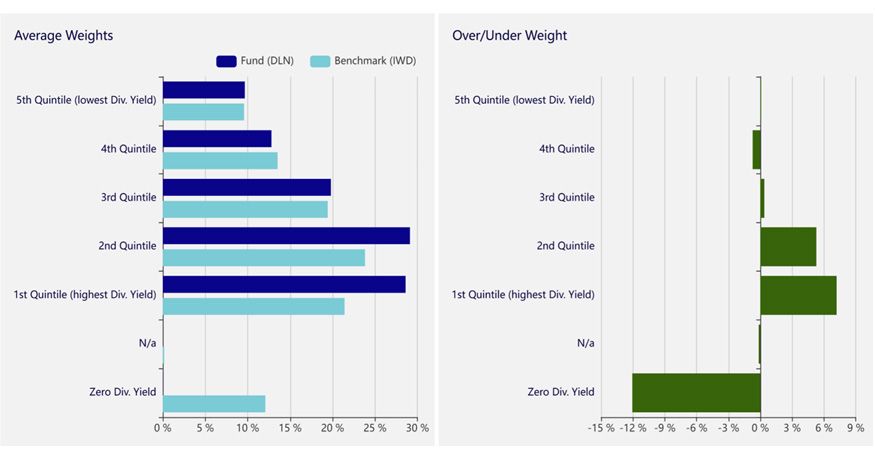
Sources: WisdomTree, FactSet, with data covering the 10-year period from 10/31/15 to 10/31/25 within WisdomTree's Fund Attribution Tool from within the PATH suite of tools. Past performance is not indicative of future results.
In the end, the comparison between DLN and IWD underscores that dividends are more than just a by-product of corporate cash flows. They are a deliberate screen that reshapes portfolios, performance and the very definition of value. By insisting on payouts and scaling exposure to the companies that return the most cash to shareholders, DLN has shown that dividend discipline can provide both a yield premium and a track record of competitive returns, without cutting investors off from the breadth of large-cap value opportunities. In a market grappling with fiscal strain, shifting rate dynamics and investor anxiety about durability, that blend of consistency and resilience is what gives a dividend-weighted approach its edge.
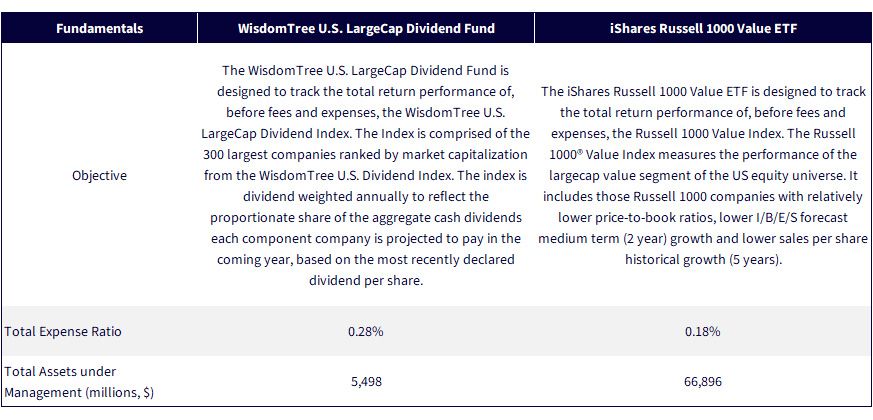
Sources: WisdomTree, FactSet and iShares fund website for assets under management. Assets under management as of 11/25/25. Subject to change.
1 Source: "Analysis of Dividends and Share Repurchases," CFA Institute, 2025.
2 Source: "Russell U.S. Equity Indexes: Construction and Methodology (Version 6.8)," London Stock Exchange Group, 2025.
All funds are managed differently and do not react the same to economic or market events. The investment objectives, strategies, policies or restrictions of funds may differ and more information can be found in their respective prospectuses. Therefore, we generally do not believe it is possible to make direct fund to fund comparisons in an effort to highlight the benefits of a fund versus another similarly managed fund.
DLN: There are risks associated with investing, including the possible loss of principal. Funds focusing their investments on certain sectors increase their vulnerability to any single economic or regulatory development. This may result in greater share price volatility. Please read the Fund’s prospectus for specific details regarding the Fund’s risk profile. Dividends are not guaranteed, and a company currently paying dividends may cease paying dividends at any time.
IWD: There are risks involved with investing in ETFs, including the possible loss of money. Shares are not actively managed and are subject to risks similar to those of stocks, including those regarding short selling and margin maintenance requirements. Ordinary brokerage commissions apply. The fund’s return may not match the return of the underlying index. The fund is subject to certain other risks. Please see the current prospectus for more information regarding the risk associated with an investment in the fund. Investments focused in a particular sector, such as technology, are subject to greater risk, and are more greatly impacted by market volatility, than more diversified investments.
U.S. LargeCap Dividend Fund

Global Head of Research
Christopher Gannatti began at WisdomTree as a Research Analyst in December 2010, working directly with Jeremy Schwartz, CFA®, Director of Research. In January of 2014, he was promoted to Associate Director of Research where he was responsible to lead different groups of analysts and strategists within the broader Research team at WisdomTree. In February of 2018, Christopher was promoted to Head of Research, Europe, where he was based out of WisdomTree’s London office and was responsible for the full WisdomTree research effort within the European market, as well as supporting the UCITs platform globally. In November 2021, Christopher was promoted to Global Head of Research, now responsible for numerous communications on investment strategy globally, particularly in the thematic equity space. Christopher came to WisdomTree from Lord Abbett, where he worked for four and a half years as a Regional Consultant. He received his MBA in Quantitative Finance, Accounting, and Economics from NYU’s Stern School of Business in 2010, and he received his bachelor’s degree from Colgate University in Economics in 2006. Christopher is a holder of the Chartered Financial Analyst Designation.

