Where to Focus in the Dividend Market


Over a decade ago, WisdomTree launched a family of dividend-weighted Indexes that were designed to manage valuation risk and increase the dividend income of an equity basket.
These Indexes appealed to my mentor, Professor Jeremy Siegel, under whom I studied at The Wharton School. He was concerned about the technology bubble in 1999 and 2000 and wrote an op-ed in the Wall Street Journal titled “Big-Cap Tech Stocks Are a Sucker Bet.” Siegel’s column listed nine stocks with triple-digit price-to-earnings (P/E) ratios that he thought could not justify their valuations, no matter how optimistic analysts were for earnings over the following decade.
The market environment after the launch of our dividend-weighted Indexes was not particularly kind to a value-tilted indexing approach, for these reasons:
- Growth beat value, particularly in large caps.
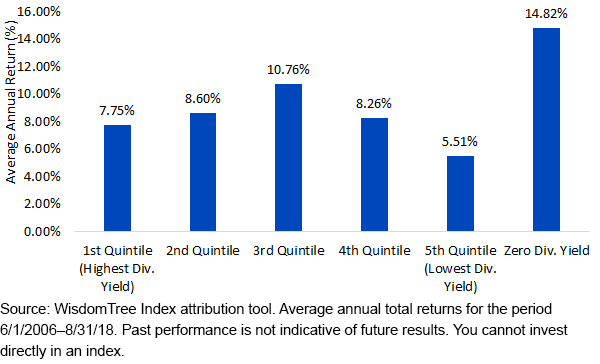
- The best segment of the market was large-cap stocks that didn’t pay dividends.
- Market multiples rose.
Looking at the returns to the S&P 500 over the last 12 years by dividend yield quintiles reveals the following:
S&P 500 Index Non-Dividend Stocks Beat Highest-Yield Segment Last 12 Years

Concerns about equity markets today often are focused on elevated market valuation multiples or fears that we are late in the economic cycle and should be tipping into recession as the Federal Reserve (Fed) raises rates. Usually, pessimistic prognosticators start with how high the cyclically adjusted P/E ratios are and how that dooms us to terrible forward-looking returns that will start a downward drift when the Fed becomes too tight.
Having an index process that systematically and strategically rebalances back to the underlying Dividend Stream®—one that incorporates a strategic sell discipline when stocks have rising price-to-dividend ratios and a buy discipline when stocks have falling price-to-dividend ratios—is a useful way to manage valuation risk.
Where is this most interesting today? While large caps receive the bulk of attention—particularly for the well-known “blue-chip” dividend payers, I think valuations in traditional market cap-weighted mid-cap and small-cap indexes, where more unprofitable and fewer dividend paying companies also are found, are particularly worthy of focus. Below, I’ll focus on the mid-cap segment and how our dividend process results in a higher dividend yield.
Reasonable Dividend Multiples?
To start, it is important to point out that valuations are not universally dramatically extended across the market. Below, I show the trailing and estimated P/E ratios across the WisdomTree Dividend Index family for large, mid- and small caps.
The estimated P/Es range from 15.6 in large caps to the mid-17s for mid-caps and small caps. Those are reasonable valuation multiples, particularly in the large-cap space, which is getting close to 5% combined return from both dividends and net buybacks. There does not have to be much greater future growth to take home close to a 5% real return with those types of current shareholder payouts.
Valuations Across the WisdomTree Dividend Index Family

While strictly looking at the latest dividend yields would show the current dividend yield of many mid-cap indexes below their average yields since 2006, when factoring in the trend for buybacks, the combined dividend and net buyback ratio for the WisdomTree U.S. MidCap Dividend Index—and, in fact, other traditional market cap indexes—is currently above their averages since 2006. This shows price appreciation over the last decade has been driven, in large part, by strong growth in both dividends and buybacks across the various mid-cap benchmarks.

Consistent Rules-Based Value Added
Also evident in the data is how a disciplined screening and rebalancing process—devoid of human emotion affecting allocations—in this dividend-weighted strategy has resulted in very consistent performance over the last 12 years our Index has been live.
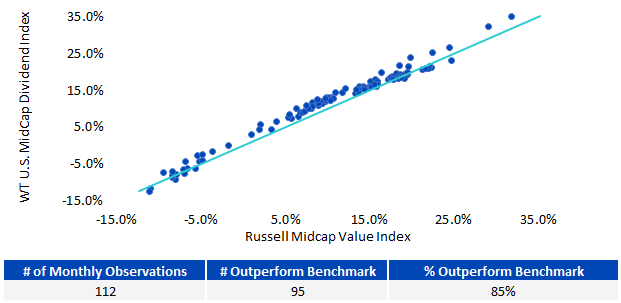
The consistency chart below plots the returns of the Russell Midcap Value Index on the x-axis and the WisdomTree MidCap Dividend Index on the y-axis.
Approximately 85% of the rolling three-year return periods the WisdomTree Index outperformed the Russell Midcap Value Index, and when the Index underperformed, it was usually very close to the market return.
But we did find periods where the rolling three-year returns were meaningfully higher.
Manager Consistency 3-Year Rolling
(6/1/06-8/31/18)


Latest Performance Standout
The latest three-year performance for the WisdomTree U.S. MidCap Dividend Index versus the Russell Midcap Value Index was one of the better three-year performance differentials for a dividend strategy compared with a traditional price-to-book value sorting strategy.
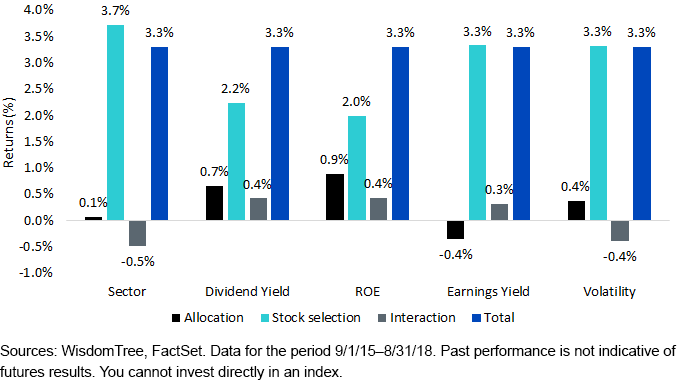
This is a little surprising given the general increase in interest rates that we have seen over the last three years, particularly from mid-2016. One can look at attribution and get a sense this outperformance was not from a differential in sector weights or other factors but, rather, better stock selection within most of the factors we examined. This is true whether one looks at sector weights, dividend yield quintiles, ROE quintiles, earnings yield quintiles or volatility quintiles
Attribution Shows Stock Selection Was Key Driver of Returns over the Last Three Years

See more details on the WisdomTree U.S. MidCap Dividend Index attribution.
When looking at past performance like this, one must wonder whether the differential will “mean revert” and underperform over the next three years. Our systematic process to lower weight to stocks that are seeing prices appreciate more than their dividends is one of the reasons we like this dividend-weighted process—it will de-risk and take chips off the table as its stocks get more expensive.
While most people look at large caps for dividends, we believe the track record of this mid-cap strategy shows these mid-caps are often overlooked.

Jeremy Schwartz has served as our Global Chief Investment Officer since November 2021 and leads WisdomTree’s investment strategy team in the construction of WisdomTree’s equity Indexes, quantitative active strategies and multi-asset Model Portfolios. Jeremy joined WisdomTree in May 2005 as a Senior Analyst, adding Deputy Director of Research to his responsibilities in February 2007. He served as Director of Research from October 2008 to October 2018 and as Global Head of Research from November 2018 to November 2021. Before joining WisdomTree, he was a head research assistant for Professor Jeremy Siegel and, in 2022, became his co-author on the sixth edition of the book Stocks for the Long Run. Jeremy is also co-author of the Financial Analysts Journal paper “What Happened to the Original Stocks in the S&P 500?” He received his B.S. in economics from The Wharton School of the University of Pennsylvania and hosts the Wharton Business Radio program Behind the Markets on SiriusXM 132. Jeremy is a member of the CFA Society of Philadelphia.

