

Style Cycles and the Case for a Middle Path
Published June 11, 2025

Christopher Gannatti, CFA
Global Head of Research
Key Takeaways
- Style leadership between growth and value has fluctuated over the decades, making it difficult to time shifts and reinforcing the case for diversified, core-like strategies.
- In a market shaped by macro shocks, volatility and sharp reversals, strategies like the WisdomTree Equity Premium Income Fund (WTPI) offer a balanced alternative—anchored in S&P 500 sensitivity and enhanced with options to smooth returns and generate income.
- WTPI has been strong in income generation, positioning it as a compelling solution for investors seeking stability, yield and resilience across market cycles.
Market leadership is not permanent. It migrates, often stealthily, sometimes violently, from one style to another—leaving in its wake narratives, portfolios and institutional convictions that suddenly feel out of sync. One of the most enduring rotations in financial markets is the oscillation between growth and value. It is not a pendulum swinging on schedule, but a more chaotic relay—one in which the baton passes not with predictability, but with force when macroeconomic conditions, liquidity and innovation converge to rewrite the rules.
In the 1990s, it was growth—powered by productivity, the internet and the belief that valuation multiples could stretch forever. Then came the early 2000s, when the popping of that bubble handed the baton to value. A decade later, following the global financial crisis, growth made a roaring comeback, this time underpinned by zero interest rates and the digital transformation of the global economy. And in 2022–2023, as inflation reawakened and central banks turned hawkish, value re-emerged, albeit briefly, to assert leadership.
Figure 1 shows the rolling 10-year annualized returns of the Russell 1000 Growth and Russell 1000 Value indexes from 1988 through April 2025. What emerges is not a steady outperformance of one style over another, but an evolving contest of dominance. You can see periods when growth was clearly ascendant—late 1990s, post-2010—followed by phases where value held its own or led. Crucially, the chart reminds us that these leadership cycles last long enough to build conviction, but not long enough to be permanent.
If you've ever wondered why style diversification matters, or why it's so hard to time factor rotations, this visual tells a powerful story. It also raises timely questions: Where are we in the cycle today? Is the post-2020 growth resurgence peaking—or just pausing? And what might it take for value to reclaim the lead once again?
Figure 1: Decoding Decades: What 10-Year Returns Reveal about Style Leadership
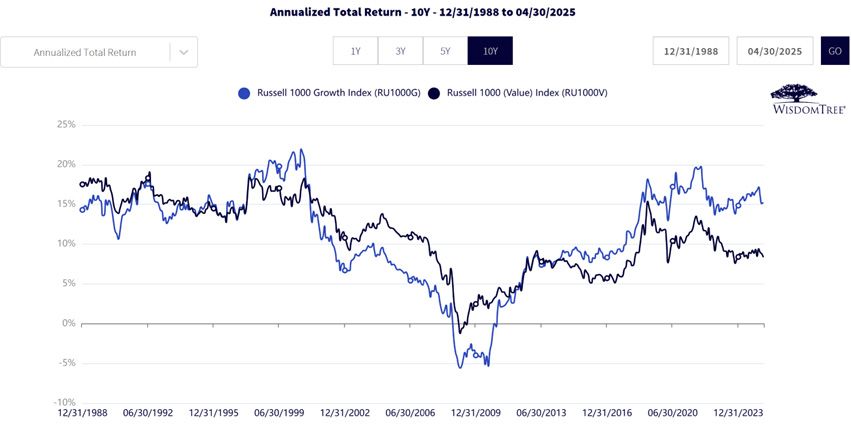
Sources: WisdomTree, FactSet, specifically data from the Fund Comparison Tool in the PATH suite of tools, accessed 5/28/25, with returns as of 4/30/25. Past performance is not indicative of future results. You cannot invest directly in an index.
Figure 2: Standardized Performance
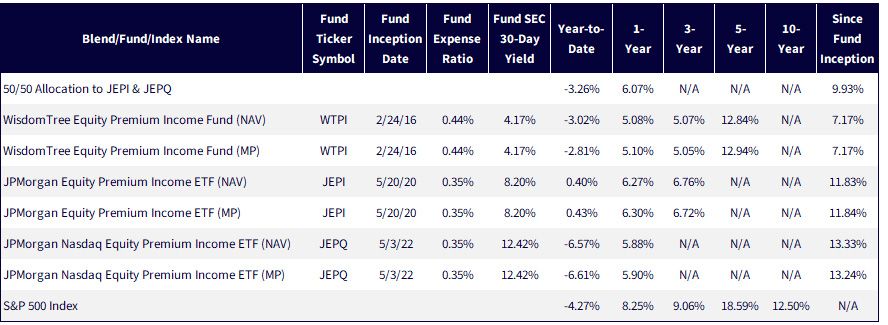
Sources: WisdomTree, FactSet, specifically data from the Fund Comparison Tool in the PATH suite of tools, accessed 5/28/25, with returns as of 3/31/25. Fund SEC 30-Day Yield as of 3/31/25. NAV denotes total return performance at net asset value. MP denotes market price performance. Prior to 4/4/25, WTPI was known as the WisdomTree PutWrite Strategy Fund (PUTW). On that date, the Fund's investment policy changed. Prior to 10/24/22, the WisdomTree PutWrite Strategy Fund was named the WisdomTree CBOE S&P 500 PutWrite Strategy Fund and tracked the total return performance, before fees and expenses, of the CBOE S&P 500 PutWrite Index. The performance data quoted represents past performance. Past performance is not indicative of future results. Investment return and principal value of an investment will fluctuate so that an investor's shares, when redeemed, may be worth more or less than their original cost. Current performance may be lower or higher than the performance data quoted. For the most recent month-end and standardized performance, click the relevant ticker: WTPI, JEPI, JEPQ.
In a market increasingly defined by sharp rotations and crosscurrents, investors are rethinking what "core" should look like. Beta exposure to broad benchmarks like the S&P 500 Index can be powerful—but it also comes with the full force of drawdowns and volatility. At the same time, defensive equity-income strategies have become a magnet for flows in recent years, especially those that use derivatives to harvest premium in exchange for giving up some upside. The real question is not whether one is better than the other, but whether blending style-divergent strategies can create a more resilient profile for the middle of the portfolio.
Three standout strategies in this space—the JPMorgan Equity Premium Income ETF (JEPI), JPMorgan Nasdaq Equity Premium Income ETF (JEPQ) and WisdomTree Equity Premium Income Fund (WTPI)—offer differentiated exposures under the hood, even though they all fall under the Morningstar "Derivative Income" umbrella. JEPI leans more value and defensive, JEPQ tilts toward high-growth tech via a Nasdaq 100-aligned equity basket, and WTPI aims for the middle, rooted in selling put options with an underlying of the S&P 500 Index. All three aim to generate yield through options overlays, which naturally introduces a structural trade-off: they tend to lag when markets are grinding higher, but may buffer downside in more turbulent environments, especially when rising volatility leads to larger option premiums.
The chart below illustrates how these return profiles have played out in recent history—2023, 2024 and year-to-date 2025. It also introduces a blended 50/50 portfolio of JEPI and JEPQ, asking an important question: Can this mix deliver a more "core-like" experience while still benefiting from the style and volatility diversification of its components? To review:
- Our premise is that it is difficult to predict the swings between value or growth U.S. equity market leadership. A core strategy could be one way to avoid sitting on one side or the other.
- Our experiment is to see how well a 50/50 blend of JEPI and JEPQ might achieve a "core-like" performance experience.
- WTPI sells put options with the S&P 500 Index as the underlying—this benchmark is neither value nor growth oriented and is one of the most widely followed core U.S. equity benchmarks.
In 2023, JEPQ was the star performer, benefitting from the AI-led growth rally. In contrast, JEPI lagged, consistent with its lower-beta, value-tilted positioning. WTPI, with its S&P 500 equity base, split the difference. But fast-forward to 2024, and a rebalancing occurred: the performance spread narrowed, the 50/50 blend smoothed volatility and all three strategies came closer to matching the S&P 500. And then came 2025—so far, marked by negative returns across the board. Here, again, the structured-income overlays are helping to mitigate some of the downside, just as the design intends.
What this chart hints at is the possibility that structure matters as much as style. And that in the face of uncertain macro conditions—sticky inflation, uneven earnings revisions, geopolitical risk—combining differentiated strategies might offer a better ballast than choosing a single winner.
Figure 3: What Survives the Style Cycle?
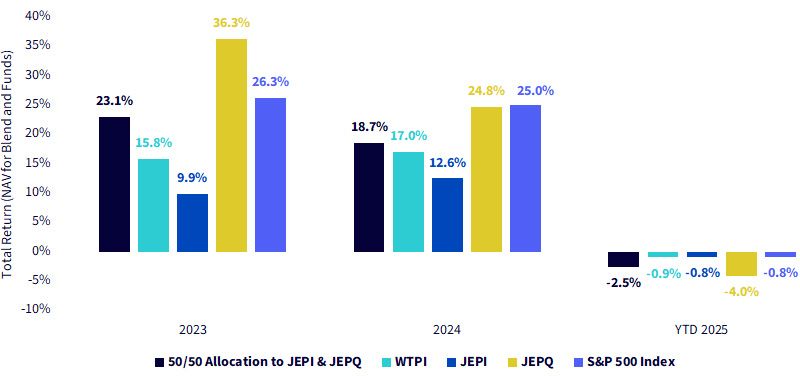
Sources: WisdomTree, FactSet, specifically data from the Fund Comparison Tool in the PATH suite of tools, accessed 5/28/25, with returns as of 5/23/25, for the YTD 2025 period. JEPQ's inception date, 5/3/22, precludes us from showing returns further back. NAV denotes total return performance at net asset value. Prior to 4/4/25, WTPI was known as the WisdomTree PutWrite Strategy Fund (PUTW). On that date, the Fund's investment policy changed. Prior to 10/24/22, the WisdomTree PutWrite Strategy Fund was named the WisdomTree CBOE S&P 500 PutWrite Strategy Fund and tracked the total return performance, before fees and expenses, of the CBOE S&P 500 PutWrite Index. Past performance is not indicative of future results. Investment return and principal value of an investment will fluctuate so that an investor's shares, when redeemed, may be worth more or less than their original cost. Current performance may be lower or higher than the performance data quoted. For the most recent month-end and standardized performance, click the relevant ticker: WTPI, JEPI, JEPQ.
Liberation Day
Markets are rarely linear in how they digest policy shocks. In early Q2 2025, global equities were jolted by the announcement of new tariffs—reviving concerns around global supply chains and corporate margins.1 From April 1–8, the market experienced a swift correction. But as often happens, nuance followed headlines: markets began stabilizing as additional details emerged, rhetoric softened and economic data surprised to the upside. The rally that followed in late April and early May underscores just how quickly market tone can shift.
Figure 4 captures this two-phase period: the initial tariff-driven drawdown and the subsequent relief rally. While all strategies posted declines during the first phase, the differences in drawdown magnitude were relatively narrow—yet instructive. WTPI, which anchors its equity exposure in the broad S&P 500, declined 10.0%, placing it between the more growth-sensitive JEPQ (−11.5%) and the more defensive JEPI (−9.9%). This consistency reflects WTPI's strategic positioning as a balanced core solution, one that doesn't rely on extreme style tilts to achieve its objectives.
During the rebound, WTPI again posted middle-of-the-pack performance: 7.8%, behind the higher-octane JEPQ at 10.4%, but ahead of JEPI at 6.3%. While not the top performer, WTPI's profile over both phases may be viewed favorably for its reduced performance whiplash—capturing a meaningful portion of the upside while limiting the depth of the drawdown, without swinging too far in either direction.
The takeaway is subtle but important: in environments marked by fast-changing macro narratives, volatility spikes and sentiment reversals, a strategy like WTPI may offer a more measured path. Its broad benchmark, the S&P 500 Index, serving as the underlying for the selling of put options, delivered defensive equity income without the extremes of either style or structure. That positions it as a credible candidate for investors seeking smoother performance through uncertain regimes.
So, while pure growth or value tilted funds like JEPQ or JEPI can shine depending on the market moment, WTPI's steadiness may appeal most to those seeking a durable middle ground.
Figure 4: Charting a Middle Path
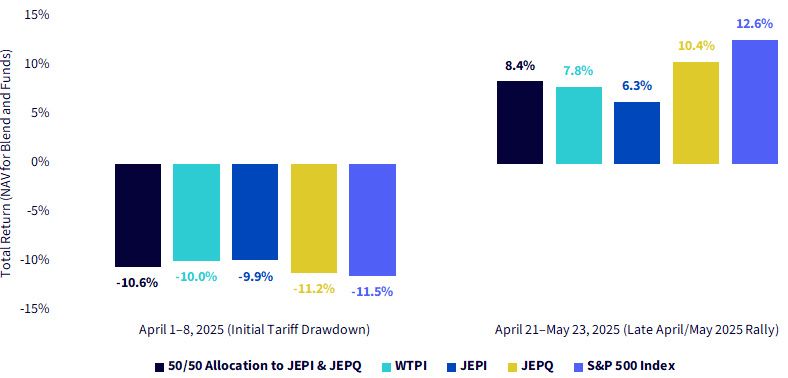
Sources: WisdomTree, FactSet, specifically data from the Fund Comparison Tool in the PATH suite of tools, accessed 5/28/25, with returns as of the specified periods. NAV denotes total return performance at net asset value. Prior to 4/4/25, WTPI was known as the WisdomTree PutWrite Strategy Fund (PUTW). On that date, the Fund's investment policy changed. Prior to 10/24/22, the WisdomTree PutWrite Strategy Fund was named the WisdomTree CBOE S&P 500 PutWrite Strategy Fund and tracked the total return performance, before fees and expenses, of the CBOE S&P 500 PutWrite Index. Past performance is not indicative of future results. Investment return and principal value of an investment will fluctuate so that an investor's shares, when redeemed, may be worth more or less than their original cost. Current performance may be lower or higher than the performance data quoted. For the most recent month-end and standardized performance, click the relevant ticker: WTPI, JEPI, JEPQ.
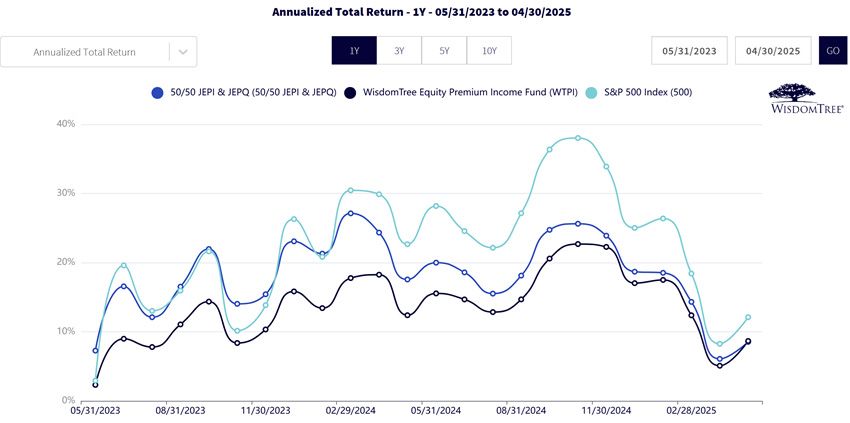
Momentum is easy to admire when markets are rising—but resilience is what you value when markets break stride. This chart tracks the rolling one-year total returns from May 2023 to April 2025 for three strategies: WTPI, the 50/50 JEPI-JEPQ blend and the S&P 500. What emerges is a telling pattern: while the S&P 500 delivered higher peaks, it also experienced sharper valleys. In contrast, WTPI held its ground more consistently, delivering smoother returns across a volatile period marked by AI exuberance, rate uncertainty and policy-driven pullbacks.
For advisors and allocators evaluating strategies not just on peak returns, but on path dependency and portfolio smoothing, WTPI's profile may stand out. It's not just about how high a strategy climbs—it's also about how comfortably it travels through the inevitable storms.
Figure 5: Analysis of Rolling Returns
Sources: WisdomTree, FactSet, specifically data from the Fund Comparison Tool in the PATH suite of tools, accessed 5/28/25, with returns as of the specified periods. NAV denotes total return performance at net asset value. Prior to 4/4/25, WTPI was known as the WisdomTree PutWrite Strategy Fund (PUTW). On that date, the Fund's investment policy changed. Prior to 10/24/22, the WisdomTree PutWrite Strategy Fund was named the WisdomTree CBOE S&P 500 PutWrite Strategy Fund and tracked the total return performance, before fees and expenses, of the CBOE S&P 500 PutWrite Index. Past performance is not indicative of future results. Investment return and principal value of an investment will fluctuate so that an investor's shares, when redeemed, may be worth more or less than their original cost. Current performance may be lower or higher than the performance data quoted. For the most recent month-end and standardized performance, click the relevant ticker: WTPI, JEPI, JEPQ.
Conclusion: The Potential for Income Generation
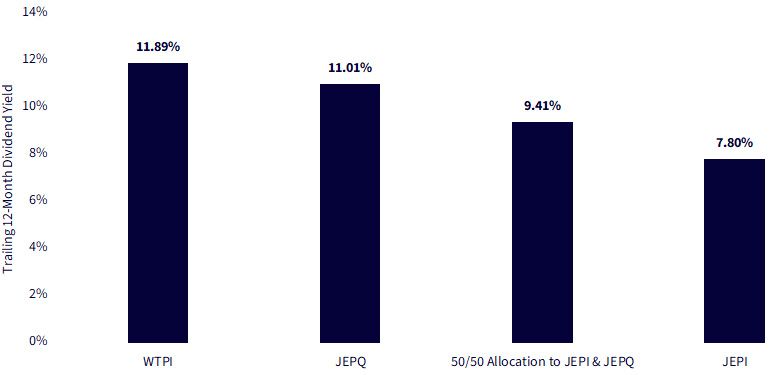
For many investors, the goal isn't to simply chase the highest total return—it's to generate strong, repeatable outcomes with meaningful income along the way. And while total return charts offer important insights into volatility and style sensitivity, trailing 12-month yield remains a central pillar for strategies in the derivative income category. The chart below provides a clear perspective: WTPI has led the field with the highest trailing 12-month dividend yield—11.89%—outpacing both JEPI and JEPQ, as well as a 50/50 blend of the two.
Past performance is not indicative of future results. Investment return and principal value of an investment will fluctuate so that an investor's shares, when redeemed, may be worth more or less than their original cost. Current performance may be lower or higher than the performance data quoted. To view the fund prospectus, click the relevant ticker: WTPI, JEPI, JEPQ.
This level of yield doesn't come without nuance—it's structurally tied to option premium capture, which in turn depends on volatility levels, option demand and how often the market trends directionally.
For those seeking a total return strategy with a strong income backbone, WTPI may offer the best of both worlds: core-like exposure and a high potential income. In a world where traditional income sources—like bonds or dividend stocks—are often subject to their own regime risks, income strategies with structural flexibility and embedded diversification can serve as powerful complements or even anchors.
In that sense, WTPI isn't just about delivering income—it's about reframing how investors think about core allocations in a market that no longer rewards static assumptions.
Figure 6: Comparison of Different Trailing 12-Month Dividend Yield Levels
Sources: WisdomTree, Morningstar, FactSet, and fund sponsor websites. Data is as of market close, 5/27/25. Past performance is not indicative of future results. Investment return and principal value of an investment will fluctuate so that an investor's shares, when redeemed, may be worth more or less than their original cost. Current performance may be lower or higher than the performance data quoted.
Figure 7: Additional Information
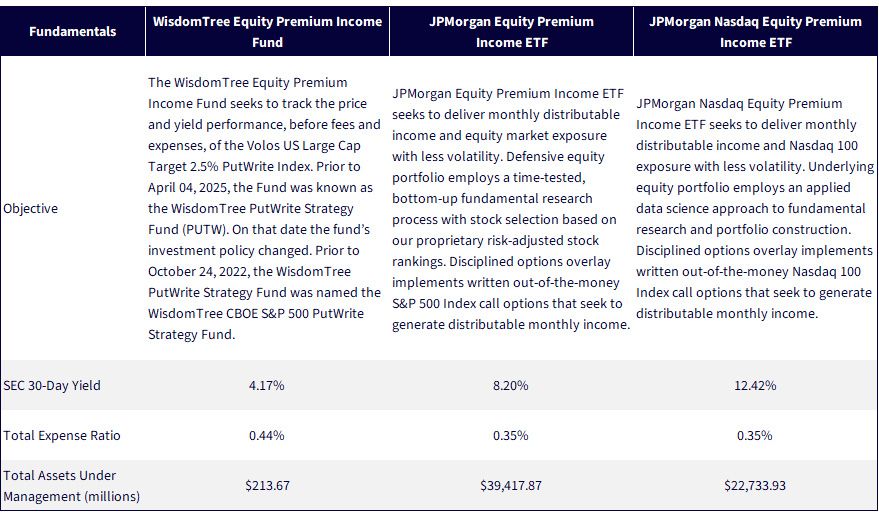
Sources: WisdomTree's Fund Compare tool and JPMorgan's specific fund pages on the JPMorgan website. Assets under management data is as of 3/31/25. Subject to change. JEPI and JEPQ were chosen for comparison points because they are among the most widely recognized strategies in the ‘Derivative Income’ category, offering differentiated exposures from WTPI while employing similar equity income approaches. All funds are managed differently and do not react the same to economic or market events. The investment objectives, strategies, policies or restrictions of other funds may differ and more information can be found in their respective prospectuses. Therefore, we generally do not believe it is possible to make direct fund to fund comparisons in an effort to highlight the benefits of a fund versus another similarly managed fund. To view the fund prospectus, click the relevant ticker: WTPI, JEPI, JEPQ.
1 Source: https://www.whitehouse.gov/videos/my-fellow-americans-this-is-liberation-day-april-2-2025-president-donald-j-trump-%F0%9F%87%BA%F0%9F%87%B8%F0%9F%A6%85/
Important Risks Related to this Article
WTPI: There are risks associated with investing, including the possible loss of principal. The Fund will invest in derivatives, including S&P 500 Index put options (SPX Puts). Derivative investments can be volatile, and these investments may be less liquid than securities, and more sensitive to the effects of varied economic conditions. The value of the SPX Puts in which the Fund invests is partly based on the volatility used by market participants to price such options (i.e., implied volatility). The options values are partly based on the volatility used by dealers to price such options, so increases in the implied volatility of such options will cause the value of such options to increase, which will result in a corresponding increase in the liabilities of the Fund and a decrease in the Fund’s NAV. Options may be subject to volatile swings in price influenced by changes in the value of the underlying instrument. The potential return to the Fund is limited to the amount of option premiums it receives; however, the Fund can potentially lose up to the entire strike price of each option it sells. Due to the investment strategy of the Fund, it may make higher capital gain distributions than other ETFs. Please read the Fund’s prospectus for specific details regarding the Fund’s risk profile.
JEPQ/JEPI: The price of equity securities may fluctuate rapidly or unpredictably due to factors affecting individual companies, as well as changes in economic or political conditions. These price movements may result in loss of your investment. Investments in equity-linked notes (ELNs) are subject to liquidity risk, which may make ELNs difficult to sell and value. Lack of liquidity may also cause the value of the ELN to decline. Since ELNs are in note form, and are subject to certain debt securities risks, such as credit or counterparty risk. Should the prices of the underlying instruments move in an unexpected manner, the fund may not achieve the anticipated benefits of an investment in an ELN, and may realize losses, which could be significant and could include the fund’s entire principal investment.
Categories

About the contributor

Christopher Gannatti, CFA
Global Head of Research
Christopher Gannatti began at WisdomTree as a Research Analyst in December 2010, working directly with Jeremy Schwartz, CFA®, Director of Research. In January of 2014, he was promoted to Associate Director of Research where he was responsible to lead different groups of analysts and strategists within the broader Research team at WisdomTree. In February of 2018, Christopher was promoted to Head of Research, Europe, where he was based out of WisdomTree’s London office and was responsible for the full WisdomTree research effort within the European market, as well as supporting the UCITs platform globally. In November 2021, Christopher was promoted to Global Head of Research, now responsible for numerous communications on investment strategy globally, particularly in the thematic equity space. Christopher came to WisdomTree from Lord Abbett, where he worked for four and a half years as a Regional Consultant. He received his MBA in Quantitative Finance, Accounting, and Economics from NYU’s Stern School of Business in 2010, and he received his bachelor’s degree from Colgate University in Economics in 2006. Christopher is a holder of the Chartered Financial Analyst Designation.