GTR
Target Range Fund

Published March 9, 2026

Global Head of Research
In recent years, markets have rewarded risk. Equity indices have climbed to elevated levels, volatility has periodically spiked but rarely lingered, and traditional 60% equity / 40% fixed income portfolios have faced new pressures as bonds may no longer provide the same cushion for equity market drawdowns as they once did. Many remember 2022 as an example of this.1
Investors are therefore left with a paradox: strong trailing returns, but persistent unease about what might come next. Whether the concern is geopolitical shocks, earnings uncertainty or simply the inevitability of the next “risk-off” episode, many are asking a different question than they did a few years ago. Not “How do I maximize upside?” but “How do I stay invested in an overall portfolio strategy while reducing the damage of a major drawdown, should it occur?”
Target range strategies are designed to answer exactly that question. Rather than owning stocks outright, they use options to define a range of potential outcomes over a specific time period.
Let’s look at the WisdomTree Target Range Fund (GTR) as an example of such a strategy to concretely anchor further considerations.
In simple terms, the strategy buys call options that are already 15% in-the-money and sells call options that are 15% out-of-the-money, creating what is known as a call spread.
Call Spread, Explained2
Now, investors rarely wake up saying, “I need a call spread.” What they say instead is: “Markets have run a long way—what happens if we give some of that back?” Or, “I still want equity exposure, but I can’t afford another 20% drawdown.” After 2022 reminded everyone that both stocks and bonds can fall together, the old diversification playbook feels less automatic.
The real tension isn’t about eliminating risk; it’s about reshaping it. Many investors want to stay in the market because stepping aside entirely risks missing long-term compounding. But they also want clearer boundaries around potential losses. That psychological and portfolio tension, these ideas of participation versus protection, is what naturally leads to structured approaches.
A call spread emerges not as a speculative tactic, but as a compromise: participate in equity upside within a defined range, while explicitly limiting how much capital is at risk over a given period.
To execute a call spread, one must buy a call option, referenced as being ‘long a call’ or a ‘long call’, and one must sell a different call option, referenced as being ‘short a call’ or a ‘short call.’ The underlying asset is the same, but the strike prices are different. Effectively, the long call provides participation in equity upside from a lower starting point, while the short call helps finance that position by capping gains beyond a predetermined level.
Bottom line: The net effect of a call spread is a return profile that seeks to participate in market appreciation within a band, while limiting potential annual losses primarily to the net option premium paid. Because the strategy resets annually, and can “restrike” if markets rally through the cap, it is dynamic rather than static, adjusting its upside ceiling as conditions evolve.
The WisdomTree Target Range Fund (GTR) packages this structure into a single ETF. It applies the call-spread framework across four major equity exposures—Large Market capitalization U.S. equities
3 (50%), Small Market capitalization U.S. equities4 (20%), Developed International equities5 (20%) and Emerging Markets equities6 (10%)—creating a globally diversified equity footprint.
At the start of each annual period, GTR purchases one-year call options that are 15% in-the-money and sells one-year calls that are 15% out-of-the-money on each underlying ETF. The remaining capital is held in a collateral account, typically invested in fixed income instruments.
As noted, equity markets decline, losses are generally limited to the net cost of the call spreads; if markets rise meaningfully, the strategy can reset its strike levels to maintain participation within a newly defined range. The result is not a guarantee of protection, nor an uncapped equity substitute. It is a deliberate trade-off: exchange some upside beyond a ceiling for a defined approach to mitigating large drawdowns. For investors who believe the next phase of the cycle may be more volatile than the last, GTR offers a structured way to remain invested—without being fully exposed to the full force of the next downturn.
Ultimately, the theory only matters if it shows up in real markets. When equities sell off, potentially fast and hard, investors don’t care about option mechanics. They care about outcomes. Does the strategy actually fall less than the benchmark when stress hits? That’s the test that determines whether structure translates into resilience.
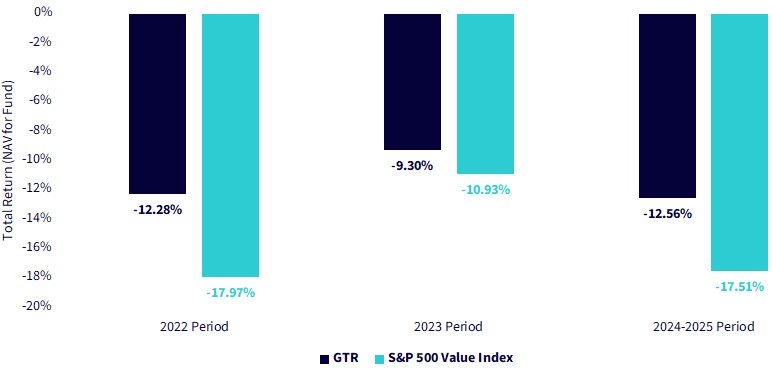
Sources: WisdomTree, FactSet, Morningstar specifically data from the Fund Comparison Tool in the PATH suite of tools, accessed February 21, 2026 with returns as of December 31, 2025. NAV denotes total return performance at net asset value. MP denotes market price performance. Past performance is not indicative of future results. Investment return and principal value of an investment will fluctuate so that an investor’s shares, when redeemed, may be worth more or less than their original cost. Current performance may be lower or higher than the performance data quoted. For the most recent month-end and standardized performance, click here.
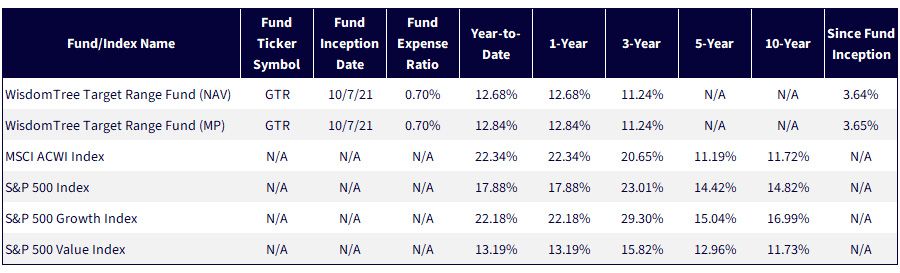
In Figure 2, we looked at drawdowns during the live performance period of GTR for core market benchmarks, specifically the MSCI ACWI Index (core equities, global benchmark) and the S&P 500 Index (core equities, U.S. benchmark).
Sources: WisdomTree, FactSet, Morningstar specifically data from the Fund Comparison Tool in the PATH suite of tools, accessed February 21, 2026 with returns as of specified periods. 2022 Period refers to Jan. 4, 2022 to Oct. 12, 2022. 2025 Period refers to Feb. 18, 2025 to Apr. 8, 2025. Drawdowns are based on the performance of the MSCI ACWI Index, as the drawdowns for the S&P 500 Index were not precisely the same dates, but only shifted a day or two here or there. NAV denotes total return performance at net asset value. Past performance is not indicative of future results. Investment return and principal value of an investment will fluctuate so that an investor’s shares, when redeemed, may be worth more or less than their original cost. Current performance may be lower or higher than the performance data quoted. For the most recent month-end and standardized performance, click here.
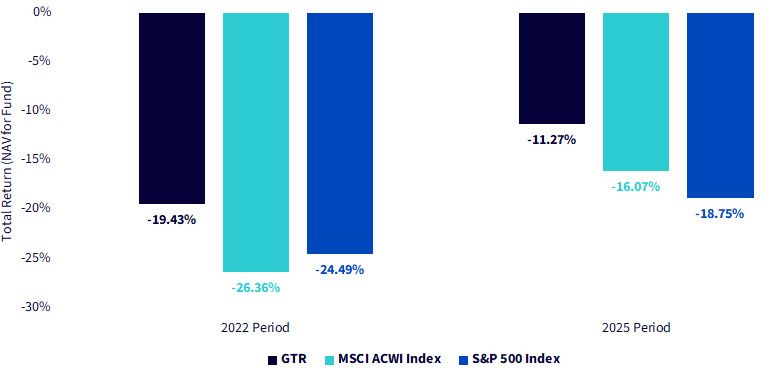
Figure 3 may be more a timely and relevant study because there is such a focus on growth equities amidst all the talk about ‘the AI trade.’ There are many investors out there who have built up significant growth or tech exposure in recent years.
Sources: WisdomTree, FactSet, Morningstar specifically data from the Fund Comparison Tool in the PATH suite of tools, accessed February 21, 2026 with returns as of specified periods. 2021-2022 Period refers to Dec. 27, 2021 to Oct. 14, 2022. 2024 Period refers to Jul. 10, 2024 to Aug. 5, 2024. 2025 Period refers to Feb 19, 2025 to Apr 8, 2025. Drawdowns are based on the performance of the S&P 500 Growth Index. NAV denotes total return performance at net asset value. Past performance is not indicative of future results. Investment return and principal value of an investment will fluctuate so that an investor’s shares, when redeemed, may be worth more or less than their original cost. Current performance may be lower or higher than the performance data quoted. For the most recent month-end and standardized performance, click here.
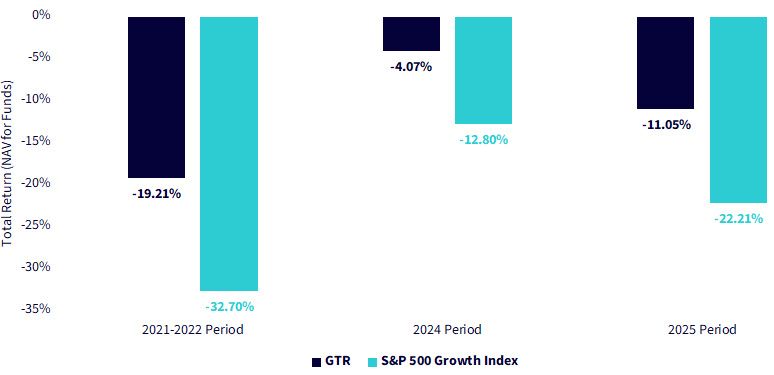
For completeness, we wanted to also review GTR's results relative to the S&P 500 Value Index. The value style has been generating more attention at the start of 2026.
Sources: WisdomTree, FactSet, Morningstar specifically data from the Fund Comparison Tool in the PATH suite of tools, accessed February 21, 2026 with returns as of specified periods. 2022 Period refers to Apr. 20, 2022 to Sept. 30, 2022. 2023 Period refers to Jul. 31, 2023 to Oct 27, 2023. 2024-2025 Period refers to Nov 29, 2024 to Apr 8, 2025. Drawdowns are based on the performance of the S&P 500 Value Index. NAV denotes total return performance at net asset value. Past performance is not indicative of future results. Investment return and principal value of an investment will fluctuate so that an investor’s shares, when redeemed, may be worth more or less than their original cost. Current performance may be lower or higher than the performance data quoted. For the most recent month-end and standardized performance, click here.
Markets will continue to rise and fall—that is not a variable investors can control. What can be controlled is how much of those swings a portfolio absorbs. The evidence across multiple stress periods suggests that structured equity exposure can meaningfully moderate drawdowns relative to broad benchmarks. GTR is not about eliminating risk or chasing every rally. It is about redefining the risk-reward balance, staying invested, compounding over time, and doing so with intentional boundaries.
1 Source: Morningstar. (2023). Just how bad was 2022’s stock and bond market performance? Morningstar.
2 Source: Options Clearing Corporation (OCC). (n.d.). Bull call spread. Options Industry Council.
3 Large market capitalization U.S. equities are defined by the S&P 500 Index universe. For operational considerations, ETF options are used for this underlying exposure.
4 Small market capitalization U.S. equities are defined by the Russell 2000 Index universe. For operational considerations, ETF options are used for this underlying exposure.
5 Developed International equities are defined by the MSCI EAFE Index universe. For operational considerations, ETF options are used for this underlying exposure.
6 Emerging Markets equities are defined by the MSCI Emerging Markets Index universe. For operational considerations, ETF options are used for this underlying exposure.
The Fund is actively managed and implements a strategy similar to the methodology of the TOPS® Global Equity Target Range® Index (the “Index”), which seeks to track the performance of a cash-secured call spread option strategy. There can be no assurance that the Index or the Fund will achieve its respective investment objectives, or that the Fund will successfully implement its investment strategy. Moreover, while the Fund seeks to target returns within a prescribed range thereby minimizing downside investment loss, there can be no guarantee that an investor in the Fund will experience limited downside protection, particularly short-term investors, investors that seek to time the market and/or investors that invest over a period other than the annual period. The Fund’s options strategy will subject Fund returns to an upside limitation on returns attributable to the assets underlying the options. The Fund’s investments in options may be subject to volatile swings in price influenced by changes in the value of the underlying ETFs or other reference asset. The return on an options contract may not correlate with the return of its underlying reference asset.
The Fund may utilize FLEX Options to carry out its investment strategy. FLEX Options may be less liquid than standard options, which may make it more difficult for the Fund to close out of its FLEX Options positions at desired times and prices. The Fund’s use of derivatives will give rise to leverage and derivatives can be volatile and may be less liquid than other securities. As a result, the value of an investment in the Fund may change quickly and without warning and you may lose money. Investment exposure to securities and instruments traded in non-U.S., developing or emerging markets can involve additional risks relating to political, economic, or regulatory conditions not associated with investments in U.S. securities and more developed international markets. These and other factors can make investments in the Fund more volatile and potentially less liquid than other types of investments. Please read the Fund’s prospectus for specific details regarding the Fund’s risk profile.
Target Range Fund

Global Head of Research
Christopher Gannatti began at WisdomTree as a Research Analyst in December 2010, working directly with Jeremy Schwartz, CFA®, Director of Research. In January of 2014, he was promoted to Associate Director of Research where he was responsible to lead different groups of analysts and strategists within the broader Research team at WisdomTree. In February of 2018, Christopher was promoted to Head of Research, Europe, where he was based out of WisdomTree’s London office and was responsible for the full WisdomTree research effort within the European market, as well as supporting the UCITs platform globally. In November 2021, Christopher was promoted to Global Head of Research, now responsible for numerous communications on investment strategy globally, particularly in the thematic equity space. Christopher came to WisdomTree from Lord Abbett, where he worked for four and a half years as a Regional Consultant. He received his MBA in Quantitative Finance, Accounting, and Economics from NYU’s Stern School of Business in 2010, and he received his bachelor’s degree from Colgate University in Economics in 2006. Christopher is a holder of the Chartered Financial Analyst Designation.

