

Gold versus Equities or Gold Plus Equities—That Is the Question!
Published November 13, 2024

Christopher Gannatti, CFA
Global Head of Research
Key Takeaways
- In 2024, gold prices reached record highs, showcasing strong performance along with equities—a rare dual rally that enhances portfolio diversification potential.
- Historical data reveals gold’s mixed performance as a hedge against equities, performing best during extreme market fluctuations, both positive and negative.
- The WisdomTree Efficient Gold Plus Equity Strategy Fund (GDE) combines equity and gold exposure through leveraged futures, achieving top-tier returns in the U.S. Large Blend category in 2024 and offering a unique approach to asset allocation.
Listen to the blog post below:
One of the more interesting developments of 2024 regards the price of gold hitting record highs after quite strong percentage gains. Let’s give these moves historical context.
The Most Recent 10 Years
First, we compared the price of gold and the S&P 500 Index on a return basis over the past 10 years. In figure 1 we see:
- Gold’s price dropped in 2015, 2018 and 2021. These were not the strongest equity market years by and large, as the S&P 500 was down in 2018, slightly positive in 2015 and up 28.7% in 2021.
- Gold’s price appreciated by more than 10% in 2017, 2019, 2020, 2023 and in 2024, so far. These years were strong on the equity side, with double-digit S&P 500 returns in each of these years.
Figure 1: The Most Recent 10 Years
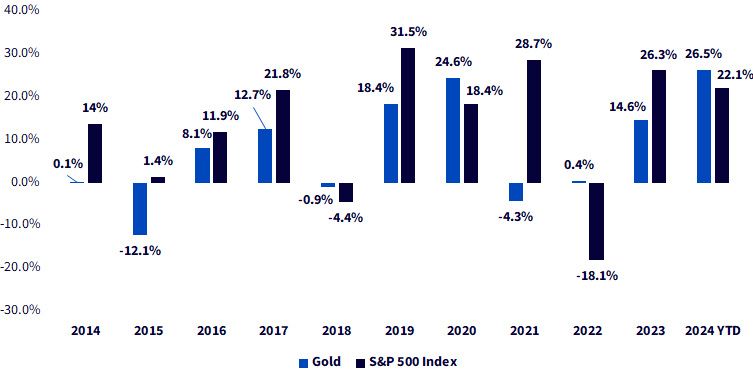
Source: Bloomberg. Gold’s price is measured by the LBMA Gold Price PM Index. 2024 YTD measures the performance from 12/31/23–9/30/24. Past
performance is not indicative of future results. You cannot invest directly in an index.
The Longer-Term Trends
On a longer-term basis, we looked back to 1967 using quarterly rather than yearly data. One of the reasons for this is evident if you go back for a moment to figure 1 and look at 2020.
- The yearly returns for gold and equities in 2020 were both quite strong, at 24.6% and 18.4%.
- Looking only at annual data, it is possible to forget how governments essentially shut down the global economy, putting many financial markets in free-fall during the first quarter of 2020. While there was a subsequent recovery, we can see more extremes as opposed to the smoother calendar year data.
In figure 2, we pulled out the 20 worst quarters of returns for the S&P 500, going back to December 29, 1967.
- Out of the 20 periods, five were associated with a negative return in the price of gold and 15 were associated with a positive return. The third quarter of 1975 was the worst, with gold down further than the S&P 500. This was not, however, the “usual” case.
Figure 2: The 20 Worst Quarters of S&P 500 Index Performance since 1967
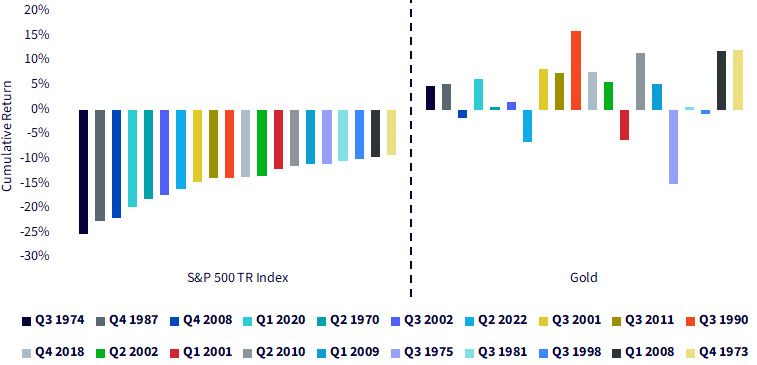
Source: Bloomberg. Gold’s price is measured by the LBMA Gold Price PM Index. Data is 12/29/1967–9/30/2024. Past performance is not
indicative of future results. You cannot invest directly in an index.
In figure 3, we flipped the script and looked at the 20 best quarters of returns for the S&P 500 over the same time frame.
- Out of the 20 periods, seven were associated with a negative return in the price of gold. The second quarter of 1980 was the most unusual, in that gold was up more than 30%, far ahead of the S&P 500 returns in that same three-month period.
Figure 3: The 20 Best Quarters of S&P 500 Index Performance since 1967
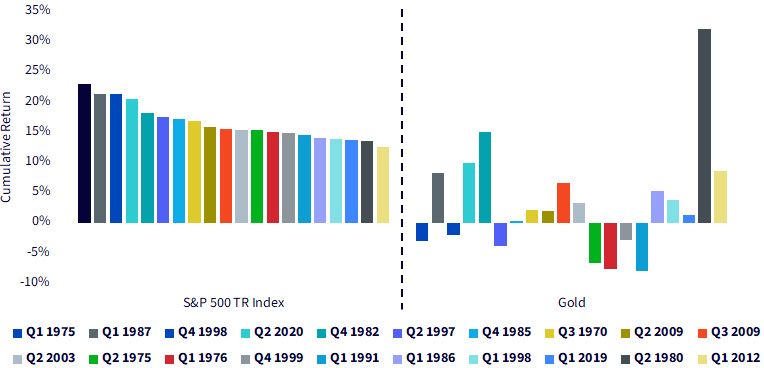
Source: Bloomberg. Gold’s price is measured by the LBMA Gold Price PM Index. Data is 12/29/1967–9/30/2024. Past performance is not
indicative of future results. You cannot invest directly in an index.
As a takeaway from this analysis, gold is not “always up” or “always down” or “always a good hedge” for various equity market scenarios. The historical record is mixed.
Monthly Data
We also analyzed characteristics for monthly returns. In figure 4, we broke out the historical record into four groupings based on the returns of the S&P 500.
- Worse than -5.0%
- Between -5.0% and 0.0%
- Between 0.0% and 5.0%
- Above 5.0%
The two best groupings for gold were the extremes—observed either when the S&P 500 returned worse than -5.0% or better than 5.0% in a month.
Figure 4: Monthly Data Indicated Gold Was More Interesting in Equity Market Extremes
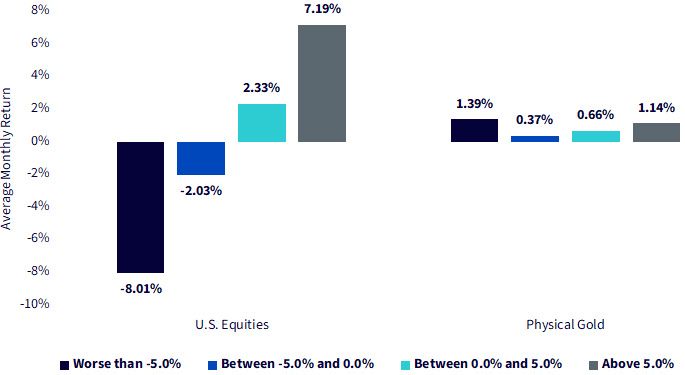
Source: Bloomberg. Gold’s price is measured by the LBMA Gold Price PM Index. Data is 12/29/1967–9/30/2024. Past performance
is not indicative of future results. You cannot invest directly in an index.
The WisdomTree Efficient Gold Plus Equity Strategy Fund (GDE)
The aforementioned historical data shown in figures 1, 2, 3 and 4 considers gold and equities as separate asset classes—we compared the return of one to the return of another, given different scenarios. GDE allows us to think not of equities versus gold, but rather of equities plus gold.
- The exposure is defined as 90% invested in the 500 largest U.S. equities, determined by market capitalization, with the other 10% in short-term U.S. Treasuries as collateral for a futures position.
- The futures position is defined as a 90% notional exposure to gold futures.
- The total exposure therefore includes the impact of leverage, as 90% exposure to equities + 90% exposure to gold futures = 180% combined exposure. Put another way, every $100 dollars is exposed to $180 notionally of equities and gold futures, split equally between the two.
- Leverage has the potential to increase the volatility of an investment relative to either of the underlying asset classes viewed individually. GDE represents a “long” position in equities and a long position in gold futures, thereby benefitting if these asset classes are delivering positive returns.
Figure 5 depicts the standardized return picture for GDE where, since inception in 2022, the Fund is up 19.82% in net asset value.
Figure 5: Standardized Returns
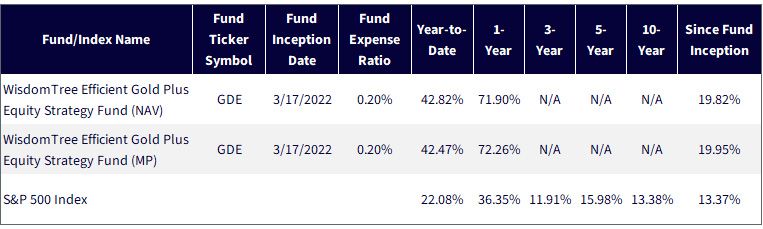
Sources: LSEG, FactSet and WisdomTree, specifically data is from the PATH Fund Comparison Tool, as of 9/30/24. NAV denotes total return
performance at net asset value. MP denotes market price performance. Past performance is not indicative of future results. Investment
return and principal value of an investment will fluctuate so that an investor’s shares, when redeemed, may be worth more or less
than their original cost. Current performance may be lower or higher than the performance data quoted. For the most recent month-
end and standardized performance, click here.
This year has certainly felt unique because we have had both gold and the S&P 500 hitting record highs at various points (and we see the year-to-date cumulative return in figure 6). We see that GDE has dramatically outperformed the S&P 500 benchmark for much of the year so far.
Figure 6: Strong Performance of GDE in 2024 So Far
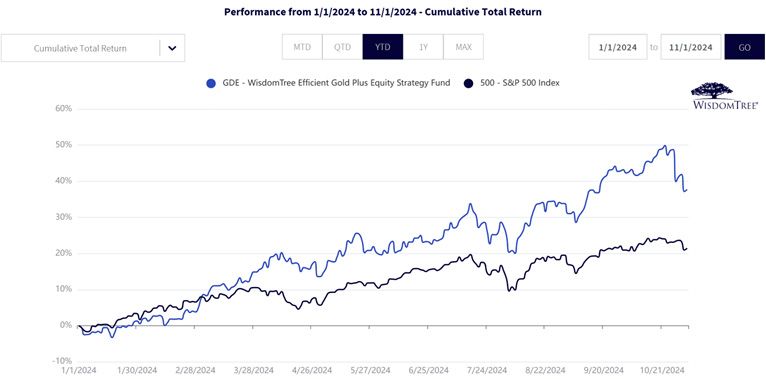
Sources: LSEG, FactSet and WisdomTree, specifically data is from the PATH Fund Comparison Tool, as of 9/30/24. NAV denotes total return
performance at net asset value. MP denotes market price performance. Past performance is not indicative of future results. Investment
return and principal value of an investment will fluctuate so that an investor’s shares, when redeemed, may be worth more or less
than their original cost. Current performance may be lower or higher than the performance data quoted.
Conclusion: It Is Rare to Be #1
Morningstar places GDE within the broader U.S. Large Blend category. The leveraged exposure to gold futures is a unique proposition.
- Year to date in 2024 and over the one-year period ended September 30, 2024, GDE was actually the TOP performing strategy in the very broad peer group—among more than 1,400 managers in each of these periods.
- Since Fund inception, for the period April 1, 2022, to September 30, 2024, GDE was actually number two out of 1,316 managers.
Adding gold futures exposure on top of traditional equities is driving these results, but holding the top position for any period in such a broad category, is an impressive feat in our opinion.
Figure 7: Ranking within the U.S. Large Blend Category
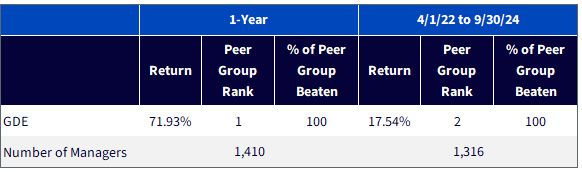
Source: Morningstar Direct, as of 9/30/24 (YTD performance through 9/30/24). US Fund Large Blend. Morningstar, Inc. All rights reserved. The information
contained herein: (1) is proprietary to Morningstar and/or its content providers; (2) may not be copied or distributed; and (3) is not warranted to be
accurate, complete or timely. Neither Morningstar nor its content providers are responsible for any damages or losses arising from any use of this
information. Past performance, rankings and ratings are no guarantee of future results. Regarding ranking of funds, 1 = Best. Morningstar rankings are
based on a fund's average annual total return relative to all funds in the same Morningstar category. Fund performance used within the rankings, reflects
certain fee waivers, without which, returns and Morningstar rankings would have been lower. The highest (or most favorable) percentile rank is 1 and the
lowest (or least favorable) percentile rank is 100. Past performance is not indicative of future results.
Solving for the Challenge of Allocating to Gold
The challenge with adding gold historically has been deciding what part of the asset allocation pie you would sell to create room for it.
But GDE provides a solution to keep exposure to traditional equities while adding a useful portfolio diversifier. The last year is a good case study showing how this worked relative to other large blend solutions. Now when you face the question, gold or equities? GDE can help you answer: why not both?!
Important Risks Related to this Article
There are risks associated with investing, including the possible loss of principal. The Fund is actively managed and invests in U.S-listed gold futures and U.S. equity securities. The Fund’s use of U.S.-listed gold futures contracts will give rise to leverage, magnifying gains and losses and causing the Fund to be more volatile than if it had not been leveraged. Moreover, the price movements in gold and gold futures contracts may fluctuate quickly and dramatically and have a historically low correlation with the returns of the stock and bond markets. U.S. equity securities, such as common stocks, are subject to market, economic and business risks that may cause their prices to fluctuate. The Fund’s investment strategy will also require it to redeem shares for cash or to otherwise include cash as part of its redemption proceeds, which may cause the Fund to recognize capital gains. Please read the Fund’s prospectus for specific details regarding the Fund’s risk profile.
Categories
About the contributor

Christopher Gannatti, CFA
Global Head of Research
Christopher Gannatti began at WisdomTree as a Research Analyst in December 2010, working directly with Jeremy Schwartz, CFA®, Director of Research. In January of 2014, he was promoted to Associate Director of Research where he was responsible to lead different groups of analysts and strategists within the broader Research team at WisdomTree. In February of 2018, Christopher was promoted to Head of Research, Europe, where he was based out of WisdomTree’s London office and was responsible for the full WisdomTree research effort within the European market, as well as supporting the UCITs platform globally. In November 2021, Christopher was promoted to Global Head of Research, now responsible for numerous communications on investment strategy globally, particularly in the thematic equity space. Christopher came to WisdomTree from Lord Abbett, where he worked for four and a half years as a Regional Consultant. He received his MBA in Quantitative Finance, Accounting, and Economics from NYU’s Stern School of Business in 2010, and he received his bachelor’s degree from Colgate University in Economics in 2006. Christopher is a holder of the Chartered Financial Analyst Designation.