
WTBN
Bianco Total Return Fund

Published July 22, 2025

Director, Fixed Income
As we've hit the halfway mark of 2025, it's a good moment to check in on one of the strong performers in our fixed income lineup: the WisdomTree Bianco Total Return Fund (WTBN). In this post, we'll walk through some key insights from Bianco Research Advisors' Mid-Year Update. We'll start with a look at how the Bianco Research Fixed Income Total Return Index, and the WTBN ETF that tracks it, have been performing. Then we'll dig into why active management has been working well in today's bond market, how to think about the "fair value" of bonds and what political pressure for rate cuts might mean going forward.
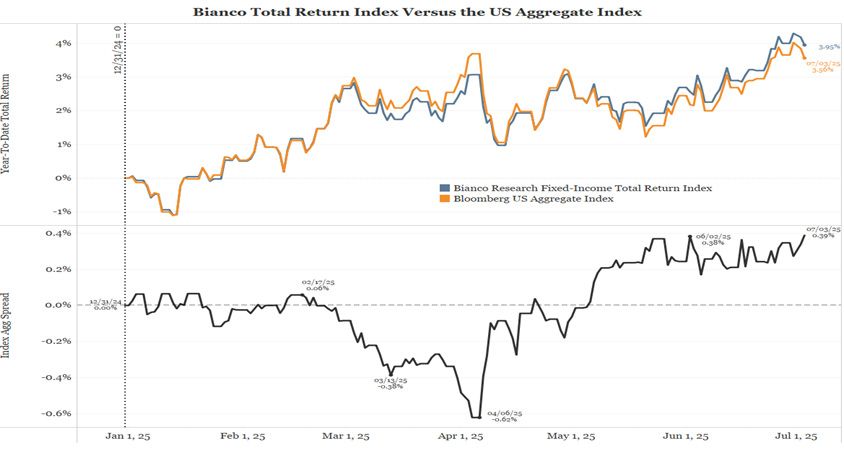
The first half of 2025 has been a strong period for both the Bianco Research Fixed Income Total Return Index and WTBN. Over this period, the Bianco Index outpaced the Bloomberg U.S. Aggregate Index by 39 basis points, adding to an already strong showing in 2024, when it beat the Bloomberg benchmark by 146 basis points.
Figure 1: Bianco Research Fixed Income Total Return Index vs. Bloomberg U.S. Aggregate Index—Total Return Comparison
Sources: Bloomberg, Bianco Research L.L.C. as of 07/03/25. Past performance does not guarantee future results. One can not invest directly into an index.
So, what's been driving this strong performance? Two key moves contributed the most. Bianco Research Advisors take a discretionary approach to managing the index, using targeted "tilts" by adjusting weightings across various factors. One major contributor to the year-to-date outperformance was the decision at the March meeting to lower the index's duration to 90% of the benchmark, right around the time the 10-Year Treasury yield hit its lows for the year. Another smart call was a timely allocation to the WisdomTree Emerging Markets Local Debt Fund (ELD) just ahead of Liberation Day, which benefited from ongoing weakness in the U.S. dollar.
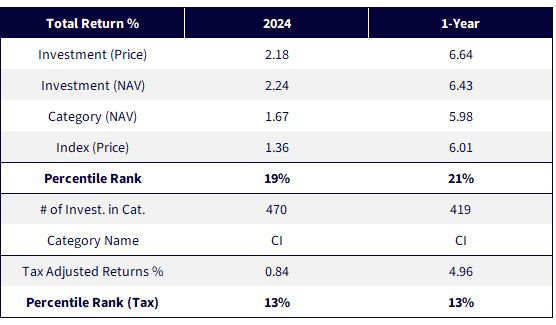
But the strong results didn't stop at the index level. The strategy also outperformed a large share of its peers, as reflected in its Morningstar ranking.
Figure 2: WTBN Morningstar Percentile Rankings
Source: Morningstar, as of 6/30/25. Tax Adjusted Returns% = Considers the impact of taxes on distributions (such as dividends and capital gains) for a hypothetical investor in the highest federal tax bracket. The process follows SEC guidelines. (State and local taxes are NOT considered). CI = Core Bond funds invest primarily in investment-grade US fixed-income issues including government, corporate, and securitized debt and hold less than 5% in below-investment-grade exposures. Morningstar, Inc., 2019. All rights reserved. The information contained herein: (1) is proprietary to Morningstar and/or its content providers; (2) may not be copied or distributed; and (3) is not warranted to be accurate, complete or timely. Neither Morningstar nor its content providers are responsible for any damages or losses arising from any use of this information. Past performance, rankings and ratings are no guarantee of future results. The % of Peer Group Beaten is the funds' total-return percentile rank compared to all funds within the same Morningstar Category and is subject to change each month. Regarding ranking of funds, 1 = Best. Performance is historical and does not guarantee future results. Current performance may be lower or higher than quoted. Investment returns and principal value of an investment will fluctuate so that an investor's shares, when redeemed, may be worth more or less than their original cost. For the most recent month-end and standardized performance, click here.
Morningstar places WTBN in the core bond fund category, alongside roughly 430 other funds. Its 2024 results were even strong, landing in the 13th percentile and beating 87% of the category. That kind of consistent outperformance highlights WTBN's edge in the actively managed bond fund space.
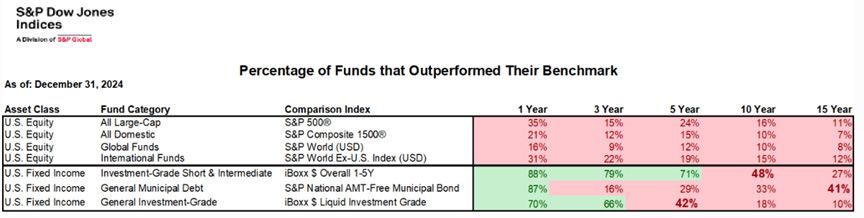
There's a widespread belief that actively managed funds—especially in the equity space, have a tough time consistently beating their benchmarks, like the S&P 500. But fixed income tells a different story. According to the S&P's semi-annual "Index vs. Active" (SPIVA) report, fixed income managers often buck that trend. While only a small number of equity managers manage to outperform their benchmarks over time (even across 15-year horizons), a much larger share of bond fund managers either outperform or come very close.
Figure 3: SPIVA Report—Active vs. Passive Bond Fund Performance
Source: S&P Global, as of 12/31/24. Past performance does not guarantee future results. One cannot invest directly into an index.For definitions of the terms in the chart above, please visit the glossary.
So why the difference between equity and bond fund performance? In the equity world, the biggest names in the index are usually top-tier performers. Think of the Magnificent 7 stocks. To beat the index, active equity managers would need to be heavily concentrated in those few high fliers, which most aren't. The bond market, on the other hand, is a different story. The largest positions in bond indexes often include what you might call the "problem children," highly indebted companies, low-yielding mortgage securities or countries burdened with too much debt. This is where active management really shines. Bond managers who can spot these potential trouble spots and steer clear of them often have a meaningful edge. And the consistent outperformance we see from many active bond managers supports that approach.
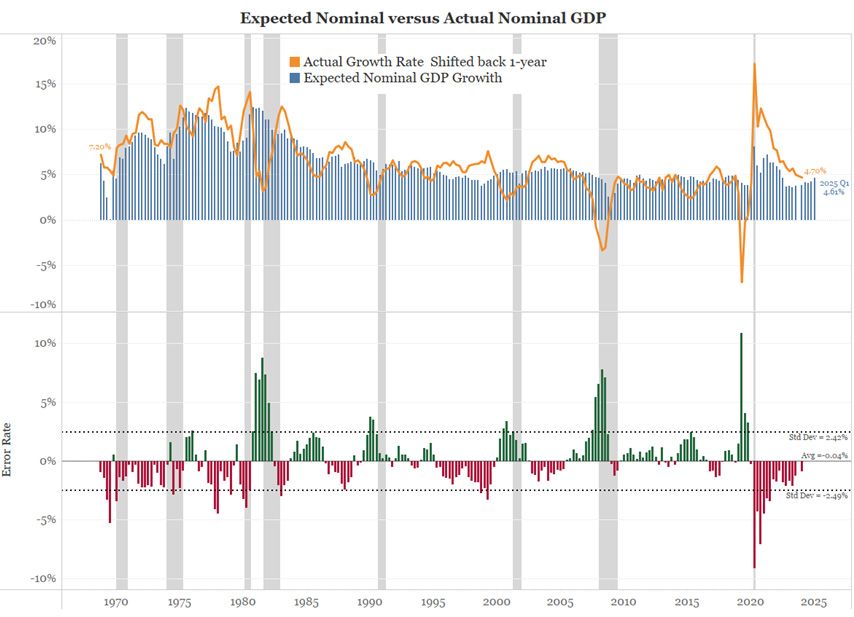
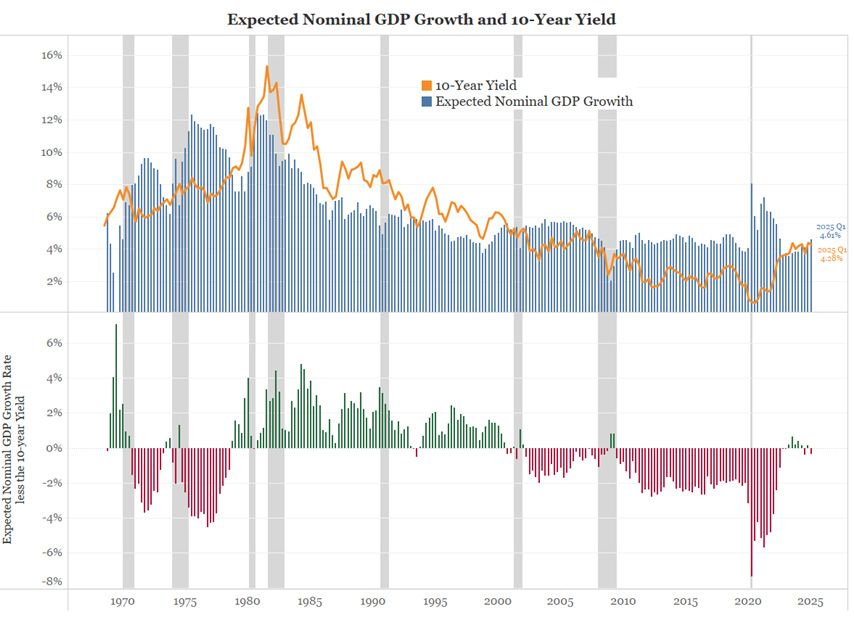
The 10-Year Treasury yield has historically followed the year-over-year growth rate of nominal gross domestic product fairly closely. Since markets are forward-looking, they tend to anchor on forecasts for nominal GDP in the year ahead. One reliable source for these projections is the Philadelphia Federal Reserve's survey of professional forecasters. Interestingly, the gap between forecasted and actual nominal GDP growth is typically quite small, averaging close to zero, which suggests these forecasts are generally pretty accurate.
Figure 4: 10-Year Treasury Yield vs. Forecasted Nominal GDP Growth
Sources: Bloomberg, Bianco Research L.L.C., as of 3/31/25.
By comparing the Philadelphia Fed's one-year forward forecast for nominal GDP with the 10-Year Treasury yield, we can get a sense of whether current yields are in line with economic expectations. As of Q1 2025, the forecast called for 4.61% nominal GDP growth, while the 10-Year yield was around 4.28%. That puts today's yield, sitting in the 4.40% to 4.50% range, right in line with where it should be. In other words, it's neither too high nor overly restrictive given the current outlook
To dig a bit deeper, looking at real yields, the 10-Year Treasury yield minus year-over-year inflation as measured by Consumer Price Index, helps explain gaps between nominal yields and nominal GDP forecasts. Historically, when the 10-Year yield has run above expected nominal GDP, it's been during periods of high, positive real yields. On the flip side, when yields lag behind GDP forecasts, real yields tend to be low or even negative. This pattern also shows up in the market for Treasury Inflation-Protected Securities (TIPS), which are widely seen as a gauge of the market's view on real yields. The close alignment between actual real yields and TIPS yields confirms that TIPS offer a solid read on both current and expected real rates. As of now, the real 10-Year yield is around 1.9%, right in line with its long-term average.
Figure 5: Real Yields vs. TIPS—Tracking Inflation-Adjusted Bond Returns
Sources: Bloomberg, Bianco Research L.L.C., as of 3/31/25.
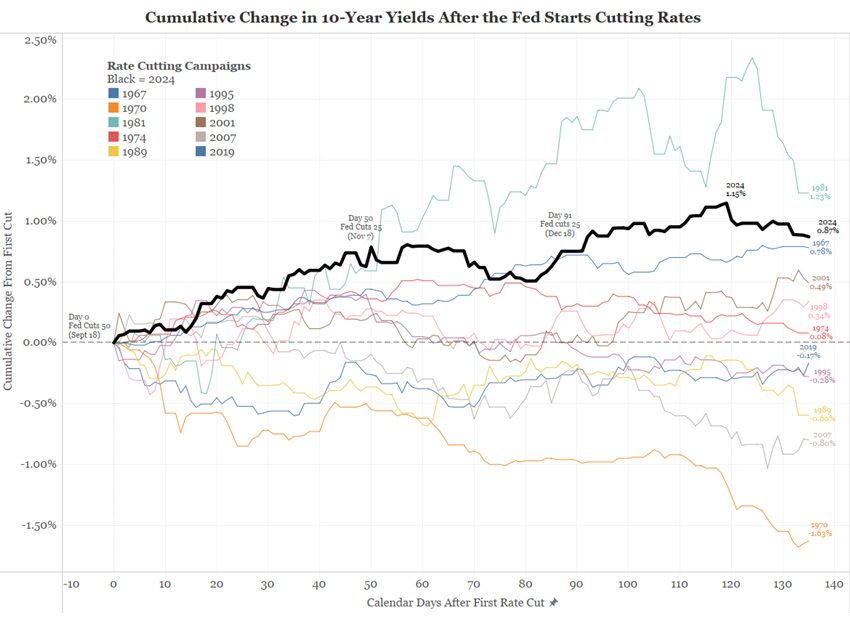
Ironically, calls from President Trump for the Fed to cut interest rates could end up pushing long-term yields higher, even though that might seem counterintuitive at first. But history shows this dynamic clearly. Take last year, for example: after the Fed began cutting rates, long-term yields didn't follow suit, they actually jumped sharply, with the 10-Year yield seeing one of its biggest increases in six decades. The reason is simple—yields aren't just set arbitrarily. They reflect underlying fundamentals like inflation expectations, economic growth prospects and government borrowing needs, all of which are captured in nominal GDP. If policy rates are cut too aggressively and fall out of sync with these fundamentals, markets may respond by pushing long-term yields up, not down.
Figure 6:Market Response to Fed Rate Cuts—Long-Term Yield Movements
The Bianco Research Fixed Income Total Return Index and WTBN have delivered strong results in the first half of 2025, outperforming both the broad market benchmark and a majority of their peers, continuing a track record of consistent success. This performance highlights the value of active management in the bond market, where spotting and steering clear of potential trouble spots can make a meaningful difference, in sharp contrast to the equity landscape.
For fixed income investors looking for a strategy that can skillfully navigate today's complex bond environment, the Bianco Research approach, reflected in WTBN, stands out. With its discretionary, research-driven process, WTBN offers a thoughtful way to add active bond exposure to a well-diversified portfolio.
There are risks associated with investing, including the possible loss of principal. Fixed income investments are subject to interest rate risk; their value will normally decline as interest rates rise. Fixed income investments are also subject to credit risk, the risk that the issuer of a bond will fail to pay interest and principal in a timely manner, or that negative perceptions of the issuer’s ability to make such payments will cause the price of that bond to decline. While the Fund attempts to limit credit and counterparty exposure, the value of an investment in the Fund may change quickly and without warning in response to issuer or counterparty defaults and changes in the credit ratings of the Fund’s portfolio investments. The Fund invests in the securities included in, or representative of, its Index regardless of their investment merit, and the Fund does not attempt to outperform its Index or take defensive positions in declining markets. Please read the Fund’s prospectus for specific details regarding the Fund’s risk profile.
Bianco Total Return Fund

Director, Fixed Income
Behnood Noei serves as Director of Fixed Income at WisdomTree Asset Management, where he develops the firm’s suite of fixed income and currency exchange-traded funds and enhances existing investment processes. Behnood has 11 years investment experience in portfolio management and quantitative research. Prior to joining WisdomTree in 2022, Behnood was a portfolio manager and developer of some of the fixed income ETFs at J.P.Morgan Asset Management, where he was directly responsible for managing more than 7 Fixed Income ETFs and multiple SMAs with more than $13Billion in assets. He graduated from The Ohio State University with Master of Science degree in Finance and is a CFA charter holder.
