
DGRW
U.S. Quality Dividend Growth Fund

Published September 26, 2024

Global Head of Research
Many are familiar with this bit of simple investment math:
Starting with $100, if the investment performance of the account drops the value to $50 at the end of the first year, what percentage return is required in the second year to bring the overall value back to $100? Many have an ingrained sense of wanting to “get back to even” after losing an amount of money, be it in a casino or in an investment.
The answer is 100%, meaning a doubling of the $50 to get back to the original $100. This becomes important in recognizing that over longer periods, there ends up a greater value in avoiding the 50% loss than in securing any particular gain.
It is difficult to reliably find opportunities that even have a chance of a 100% return in a given 12-month period.
Investors can spend a lot of time thinking about “growth” and “value” and seeking to predict which may or may not outperform going forward. Over the last 10 years, for the most part, we have seen the growth style dominate the value style. In figure 1:
When we think about the so-called “Magnificent 7” companies—Alphabet, Apple, Amazon, Microsoft, Meta Platforms, Nvidia and Tesla—for the vast majority of the past 10 years, these have been wholly on the growth side of the ledger. At different points, we have seen some of them attain overall market capitalizations of $1 trillion, $2 trillion or even, in some cases, $3 trillion. This appreciation in market capitalization has been a major driver of the 16.2% annualized return of the Russell 1000 Growth Index.
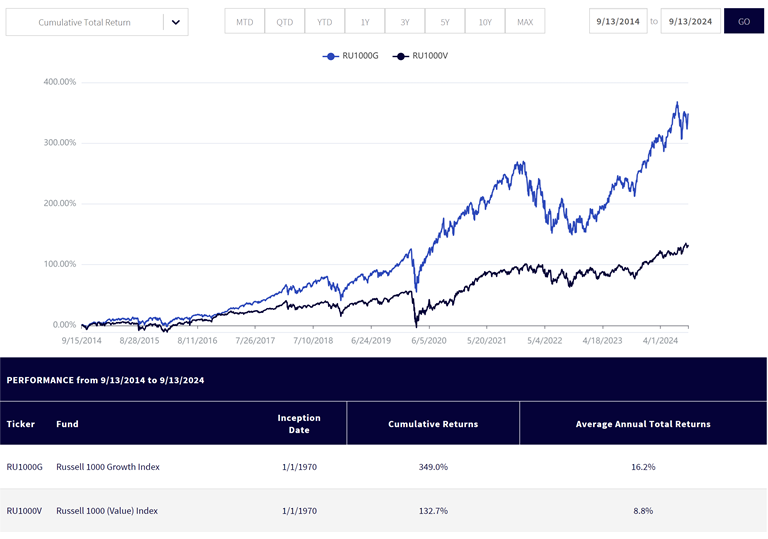
Source: WisdomTree’s Fund Comparison Tool, with data accessed on 9/16/24. Past performance is not indicative of future results. You cannot
directly invest in an index.
On May 22, 2013, WisdomTree launched the WisdomTree U.S. Quality Dividend Growth Fund (DGRW), which is designed to track the total return performance, before fees and expenses, of the WisdomTree U.S. Quality Dividend Growth Index. A key part of the genesis story behind this strategy was that many dividend-growth-oriented approaches require constituents to have demonstrated past histories of 5, 10 or even 20 years of past dividend growth.1
What’s clear is that more and more of the largest companies are starting to pay dividends. In the past, when a chunk of firms in the trillion-dollar market capitalization club were not paying dividends, there was a huge split between what was meant by “value” or “growth” as they related to dividends. From 2024 onward, it’s possible that the picture changes.
However, even with all of that said, over the past 10 years, when we know that “growth” crushed the performance of value, somehow DGRW was able to keep pace with the S&P 500 Index—an index where the so-called “growth market capitalization behemoths” have been in positions of substantial weight the entire time.
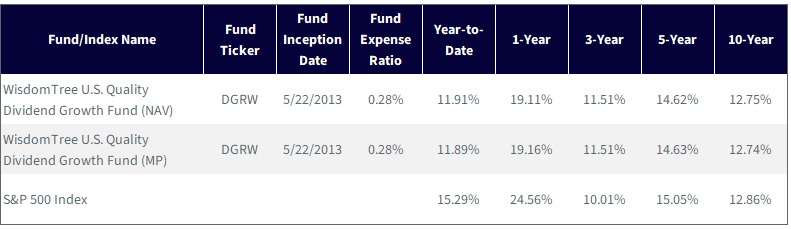
Source: WisdomTree, specifically data from the Fund Comparison Tool in the PATH suite of tools, as of 9/16/24. NAV denotes total return performance
at net asset value. MP denotes market price performance. Past performance is not indicative of future results. Investment return and principal
value of an investment will fluctuate so that an investor’s shares, when redeemed, may be worth more or less than their original cost.
Current performance may be lower or higher than the performance data quoted. For the most recent month-end and standardized
performance and to download the Fund prospectus, please click here.
The overall results were extremely close. Admittedly, the eyes dart to roughly the center of the page—the “COVID-19 drawdown.” Coming out of this drawdown, the black line—the S&P 500 Index—did end up in the lead. However, during the volatility that followed for much of 2022, the blue line—DGRW—did come back to the forefront.
That is a bit of a notable theme—even if past performance cannot tell us the future with certainty, we are starting to see the germ of a possible way to think about expectations of a difference in performance in different market regimes.
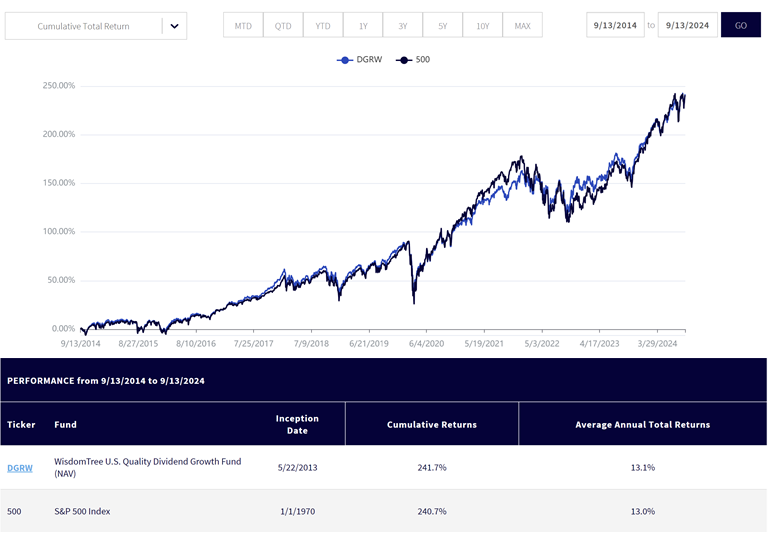
Source: WisdomTree, specifically data from the Fund Comparison Tool in the PATH suite of tools, as of 9/16/24. NAV denotes total return
performance at net asset value. MP denotes market price performance. Past performance is not indicative of future results. Investment
return and principal value of an investment will fluctuate so that an investor’s shares, when redeemed, may be worth more or less
than their original cost. Current performance may be lower or higher than the performance data quoted. For the most recent month-
end and standardized performance and to download the Fund prospectus, please click here.
In our example at the beginning of this piece, we outlined a 50% drawdown. While equities, even the S&P 500 Index, do have 50% drawdowns from time to time, fortunately, they do not often occur at this magnitude. Judging by history, drawdowns in the 10%, 20% or 30% range can and do occur far more often.
We sought to measure the performance of DGRW vs. the S&P 500 Index in “down markets,” focusing particularly on periods where we saw drawdowns of greater than 10%.
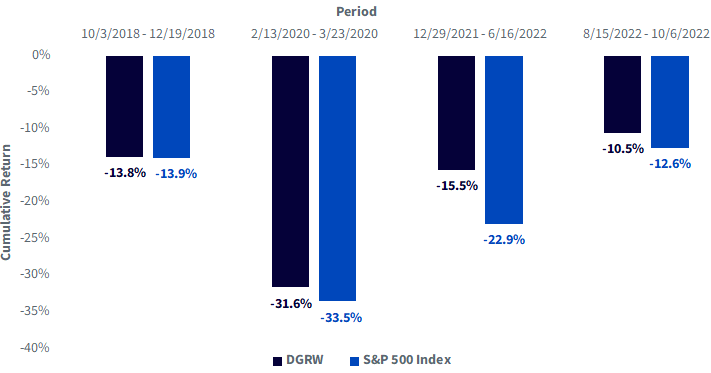
Source: WisdomTree, specifically data from the Fund Comparison Tool in the PATH suite of tools, as of 9/16/24. NAV denotes total return
performance at net asset value. MP denotes market price performance. Past performance is not indicative of future results.
Investment return and principal value of an investment will fluctuate so that an investor’s shares, when redeemed, may be
worth more or less than their original cost. Current performance may be lower or higher than the performance data quoted.
For the most recent month-end and standardized performance and to download the Fund prospectus, please click here.
Now, if an investor is preparing for a market downdraft, that is one thing, but if an investor is seeking an investment to be able to weather different environments over a 10-year period, that is quite another. It is, therefore, important that an equity strategy stays in the game in market “up” trends while also having that appropriate balance of possibly dropping less in downdrafts.
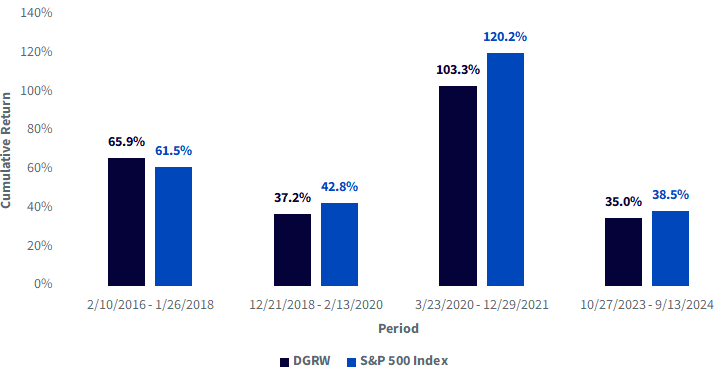
Source: WisdomTree, specifically data from the Fund Comparison Tool in the PATH suite of tools, as of 9/16/24. NAV denotes total return
performance at net asset value. MP denotes market price performance. Past performance is not indicative of future results.
Investment return and principal value of an investment will fluctuate so that an investor’s shares, when redeemed, may be
worth more or less than their original cost. Current performance may be lower or higher than the performance data quoted.
For the most recent month-end and standardized performance and to download the Fund prospectus, please click here.
The importance of a so-called “all-weather” equity strategy that has the potential to deliver a compelling return, whether the trend is up or down, is actually less about the pure numbers and more about confidence. If the strategy can give the investor the confidence to not feel the need to try to time a downturn and trade in and out periodically, the investor will then stay in the market longer and allow for the process of compounding to work more effectively.
One of the most important historical facts to remember is that some of the strongest upward moves have occurred directly after some of the most severe downward moves. It is tempting to try to time the market, but the real consequence for many who try is actually experiencing at least some of the downdraft and then missing the subsequent upward move. Missing these big upward moves has had a major impact on the long-term return picture.
1 Sources: Dow Jones U.S. Select Dividend Index Methodology, S&P U.S. Dividend Growers Methodology Factsheet and the S&P High Yield Dividend Aristocrats Index Methodology.
2 Source: https://www.apple.com/newsroom/2012/03/19Apple-Announces-Plans-to-Initiate-Dividend-and-Share-Repurchase-Program/#:~:text=Subject%20to%20declaration%20by%20the,begins%20on%20July%201%2C%202012.
3 Source: Bloomberg.
4 Source: https://investor.fb.com/investor-news/press-release-details/2024/Meta-Reports-Fourth-Quarter-and-Full-Year-2023-Results-Initiates-Quarterly-Dividend/default.aspx#:~:text=Meta%20Initiates%20Quarterly%20Dividend,business%20on%20February%2022%2C%202024.
5 Source: Alphabet investor relations press release announcing quarterly results on April 25, 2024.
There are risks associated with investing, including the possible loss of principal. Funds focusing their investments on certain sectors increase their vulnerability to any single economic or regulatory development. This may result in greater share price volatility. Dividends are not guaranteed, and a company currently paying dividends may cease paying dividends at any time. Please read the Fund’s prospectus for specific details regarding the Fund’s risk profile.
U.S. Quality Dividend Growth Fund

Global Head of Research
Christopher Gannatti began at WisdomTree as a Research Analyst in December 2010, working directly with Jeremy Schwartz, CFA®, Director of Research. In January of 2014, he was promoted to Associate Director of Research where he was responsible to lead different groups of analysts and strategists within the broader Research team at WisdomTree. In February of 2018, Christopher was promoted to Head of Research, Europe, where he was based out of WisdomTree’s London office and was responsible for the full WisdomTree research effort within the European market, as well as supporting the UCITs platform globally. In November 2021, Christopher was promoted to Global Head of Research, now responsible for numerous communications on investment strategy globally, particularly in the thematic equity space. Christopher came to WisdomTree from Lord Abbett, where he worked for four and a half years as a Regional Consultant. He received his MBA in Quantitative Finance, Accounting, and Economics from NYU’s Stern School of Business in 2010, and he received his bachelor’s degree from Colgate University in Economics in 2006. Christopher is a holder of the Chartered Financial Analyst Designation.

