

U.S. Treasuries: Break On Through to the Other Side
Published May 23, 2018

Head of Investment and Fixed Income Strategy
Last Tuesday, May 15, represented a red-letter day for the U.S. Treasury (UST) market, as the 10-Year yield moved above a key technical level and ended up posting its highest numbers since 2011. The natural question is: Now that the UST 10-Year yield has achieved this breakthrough to the other side, where can it go from here?
In prior blog posts, I have highlighted the Fibonacci technical analysis as a useful tool. This tool displays percentage lines that look at support and resistance levels, potentially signaling price/yield reversals. The concept of retracement suggests that after a period of market movement, prices/yields can retrace a prior pattern before returning to their original trend.
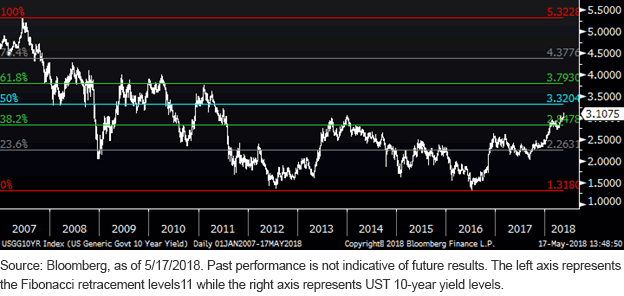
Prior to May 15, I was utilizing the five-year Fibonacci tool. In January of this year, the UST 10-Year yield level broke through the five-year Fibonacci 76.4% retracement level of 2.64%, a key development in its own right, as this level had proven to be difficult to penetrate up to that point. According to this analysis, the next stop to the upside, which would be a 100% retracement, was at 3.05%. So, while a great deal of media focus was centered on the 3% threshold, for those of us in bond-land, the key number was actually five basis points (bps) higher.
Now that the 3.05% level has been breached, one has to go back to the drawing board a bit. A first approach would be to utilize 2011 as the starting point, since that was the last time, the UST 10-Year yield was this high. Using this time frame, the next retracement level would be roughly 3.19%, representing the aforementioned 76.4% line. For the record, the 100% retracement figure rounds out to 3.77%.
I find it more insightful to go back further in time. Indeed, by elongating the analysis, I believe investors can see a wider perspective. Against this backdrop, the analysis would go back to the beginning of 2007, or before the financial crisis and great recession. As was the case with 2011 as a starting point, both studies show 1.32% (rounded) as the 0% level, but for the 2007 analysis, the 100% retracement level is 5.32%. Notably, the 50% retracement line in this case stands at 3.32%, which may prove to be the next level in play.
Conclusion
At some point, this breakout in rates needs to be validated. Indeed, the UST market has seemingly now discounted, or allowed for a lot of negative news (stronger economic growth and higher inflation expectations). Certainly, burgeoning Treasury supply needs and the Federal Reserve (Fed) pulling back on its Treasury purchases are factors that will remain a part of the rate landscape, but the other two legs of the tripod represent a data-dependent aspect to the outlook. While a potential path toward a 3.25%–3.30% level may not always be a one-way street, in my opinion, the 2007 Fibonacci analysis helps put UST 10-Year yield possibilities in some perspective. Stay tuned, it’s still only May!
Unless otherwise stated, data source is Bloomberg, as of May 17, 2018.
Categories
About the contributor

Head of Investment and Fixed Income Strategy
Kevin serves as the Head of Investment and Fixed Income Strategy. In this role, he writes macro and fixed income-related content and works closely with the sales, research and marketing teams. In addition, Kevin conducts client-facing webinars and meetings, providing expertise on WisdomTree’s existing and future bond ETFs. Prior to joining WisdomTree, Kevin spent 30 years at Morgan Stanley, where he was Managing Director and Chief Fixed Income Strategist for Wealth Management. He was responsible for tactical and strategic recommendations and created asset allocation models for fixed income securities. He was a contributor to the Morgan Stanley Wealth Management Global Investment Committee, primary author of Morgan Stanley Wealth Management’s monthly and weekly fixed income publications, and collaborated with the firm’s Research and Consulting Group Divisions to build ETF and fund manager asset allocation models. Kevin has an MBA from Pace University’s Lubin Graduate School of Business, and a B.S. in Finance from Fairfield University.