DLN
U.S. LargeCap Dividend Fund

Published March 27, 2026

Global Head of Research
For much of the past decade, investing in U.S. equities felt almost synonymous with investing in growth. Technology giants and other high-growth companies dominated index returns, leaving traditional value sectors, such as financials, energy, and industrials, trailing behind. But markets rarely move in straight lines forever. Recently, signs have emerged that the leadership dynamic may be shifting. Value-oriented stocks have begun to outperform growth after a prolonged stretch of underperformance, raising an important question for investors: are we witnessing a temporary rotation, or the early stages of a new market cycle?
Markets have a way of reminding investors that leadership rarely lasts forever. Figure 1 shows the difference in rolling 10-year annualized returns between value and growth stocks. When the line sits above zero, the value style has outperformed over the prior decade. When it dips below zero, the growth style has been in the lead.1
What stands out is how cyclical these leadership regimes have historically been, as well as how the value style was quite dominant until recently. From the late 1940s through the early 1980s, for example, value stocks delivered meaningfully higher returns than growth over rolling 10-year windows.
But, as we know, the pattern began to shift in the past decade. The sustained dominance of large-cap technology and other growth-oriented companies pushed the metric decisively into negative territory, marking one of the most pronounced periods of growth outperformance on record.
For many investors entering 2026, this is the backdrop: a long cycle of growth leadership that increasingly raises the question of whether the next style rotation could already be underway.
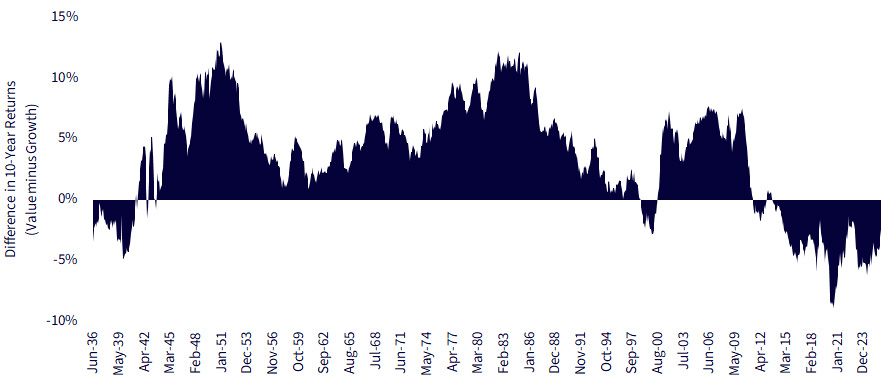
Source: French, K. R. (n.d.). Detail for portfolios formed on book-to-market. Kenneth R. French Data Library, Tuck School of Business at Dartmouth. Period based on data availability from June 30, 1926 to January 31, 2026. Past performance is not indicative of future results.
Now, many investors appreciate the capability to look at very long time horizons of historical data, but they recognize that there is always a balancing act because long history and a focus on what might be different about the present period. Additionally, sometimes it is worthwhile to zoom in on calendar year returns as opposed to rolling 10-Year periods.
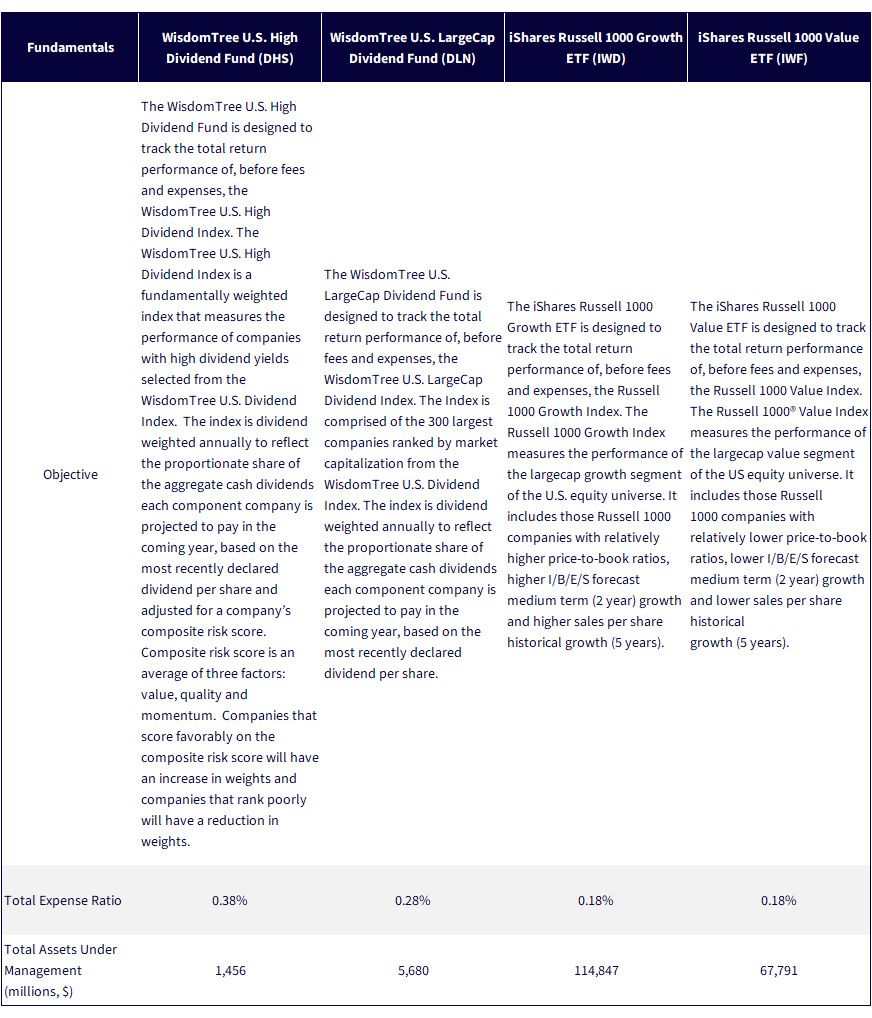
Two of the most widely referenced exchange-traded funds (ETFs) for exposure to U.S. equities when investors are looking for the ‘value’ or the ‘growth’ styles are:
Figure 2 is able to look back to 2015 at how these two ETFs have performed. This represents 11 full calendar years and then the period to start 2026, through February 28th. In nine out of the eleven full years, IWF outperformed, and there were only two years where the outperformance was less than 5%. In two out of the 11 years, IWD outperformed. One of those years was 2022, a well-known difficult equity market environment during a period of significant rising interest rates and inflation concerns.
One of the most important questions for U.S. equity investors involves looking at what we have seen so far in 2026. Do they want to position for ongoing outperformance of the value style, or do they view what we have seen so far as a ‘growth-reset’ and an opportunity to capture exposure to these types of companies after a bit of a lull.
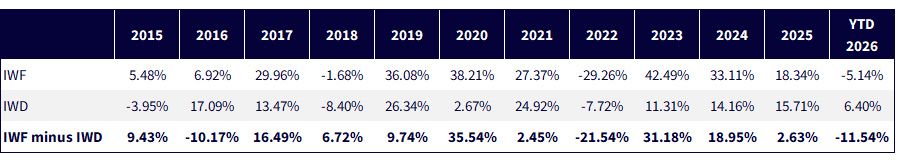
Sources: WisdomTree, FactSet and Morningstar, with data accessed on March 13, 2025. Data is shown on an NAV total return basis. For standardized performance, please look to Figure 3b in this piece. Past performance is not indicative of future returns.
WisdomTree has been managing exposures that exemplify the value style in U.S. equities since June 16, 2006. At that time, weighting companies by their dividend stream as opposed to their market capitalizations was nothing short of revolutionary. Here, we want to focus on two strategies that have been around for this nearly 20 year period:
In short, DHSfocuses exposure on relatively higher ‘dividend-yielding’ stocks, whereas DLNfocus on those large companies that pay out the largest aggregate cash dividends. In Figure 3a, we see both the long and short-term results of these approaches. DHShas come out at the start of 2026 with a real bang, when the value side of the equity ledger began to strongly outperform. One way to think about this is how the so-called ‘Mag 7’ dividend-payers do tend to be amongst the largest payers of cash dividends in the world, in many cases, but they do not tend to be amongst the highest dividend-yielding companies.
If the idea is to ‘avoid the Mag-7’, DHShas historically fit the bill. There is nothing that guarantees this will always be the case, but we can say that so far these companies have not tended toward the relatively higher dividend yields required for inclusion in this strategy.
DLN, on the other hand, does include those Mag-7 companies that pay dividends, excluding, as of March 24, 2026 only Amazon.com and Tesla because these firms have not yet declared an annual dividend policy. When we look at the longer-term track record in Figure 3a versus IWD, DLNdoes appear to be the stronger competitor, which makes sense because we know that these stocks have done well and DLN'sapproach has not systematically avoided them for extended periods.
True, we also see that, over most longer periods in Figure 3a, IWF was the winning performer, confirming largely what we already know—the growth style outperformed the value style in U.S. equities for much of the period we are able to show since these ETFs have been live.
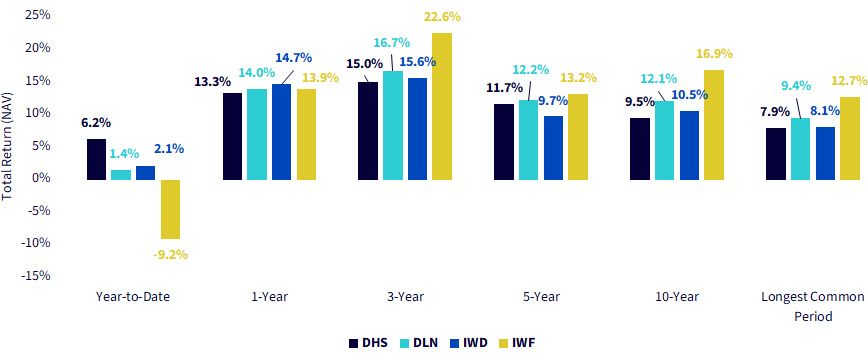
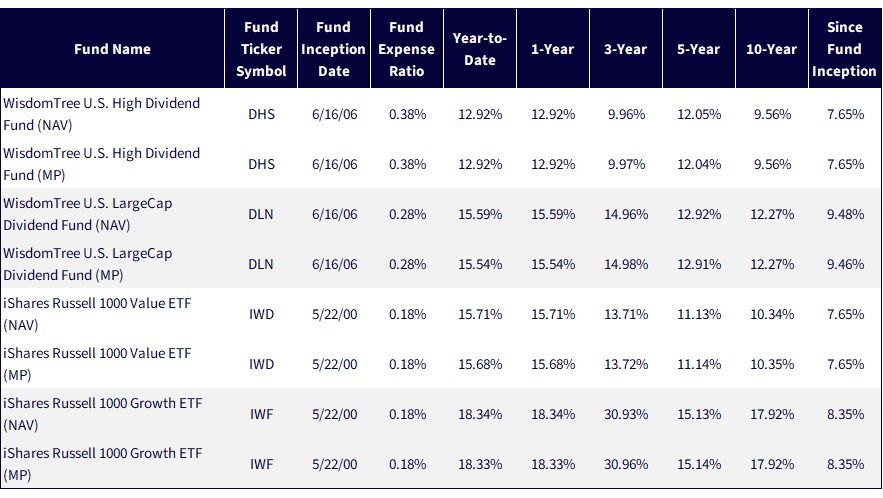
Sources: Morningstar, FactSet and WisdomTree, specifically data is from the PATH Fund Comparison Tool, accessed as of March 25, 2026, but showing returns for the period ended March 24, 2026 for Figure 3a and December 31, 2025 for 3b. NAV denotes total return performance at net asset value. MP denotes market price performance. Past performance is not indicative of future results. Investment return and principal value of an investment will fluctuate so that an investor’s shares, when redeemed, may be worth more or less than their original cost. Current performance may be lower or higher than the performance data quoted. For the most recent month-end and standardized performance, click the relevant ticker: DHS, DLN, IWD, IWF.
Market leadership rarely stays fixed for long. The past decade strongly rewarded investors who leaned into growth, particularly large technology companies that reshaped the global economy and dominated equity index performance. Yet history suggests that periods of extreme style leadership often give way to phases of rebalancing.
The early signals seen in 2026, where value-oriented companies, including higher dividend-yielding stocks, have begun to outperform, may represent the first hints of that shift. Whether this proves to be a short-term rotation or the start of a longer cycle remains uncertain. What is clear, however, is that investors who maintain diversified exposure across styles, and who remain attentive to valuation, income generation and sector leadership, may be better positioned for whatever phase of the market cycle comes next. If history is any guide, the pendulum does not stop swinging; it simply moves from one side of the market to the other.
Sources: WisdomTree, iShares. Assets under management as of March 12, 2026.
1 The source for this data is the Kenneth French data library as detailed in Figure 1. ‘Value’ refers to stocks with high book to market value ratios. ‘Growth’ refers to stocks with low book to market value ratios.
All funds are managed differently and do not react the same to economic or market events. The investment objectives, strategies, policies or restrictions of other funds may differ and more information can be found in their respective prospectuses. Therefore, we generally do not believe it is possible to make direct fund to fund comparisons in an effort to highlight the benefits of a fund versus another similarly managed fund.
DLN: There are risks associated with investing, including possible loss of principal. The Fund invests primarily in the securities of large-capitalization companies. As a result, the Fund’s performance may be adversely affected if securities of these companies underperform securities of smaller capitalization companies or the market as a whole. Dividends are not guaranteed, and a company currently paying dividends may cease paying dividends at any time. The Fund invests in the securities included in, or representative of, its Index regardless of their investment merit and the Fund does not attempt to outperform its Index. The composition of the Index is governed by an Index Committee and the Index may not perform as intended. Please read the Fund’s prospectus for specific details regarding the Fund’s risk profile.
DHS: There are risks associated with investing, including possible loss of principal. Dividends are not guaranteed, and a company currently paying dividends may cease paying dividends at any time. Funds focusing their investments on certain sectors and/or regions increase their vulnerability to any single economic or regulatory development. The Fund invests in the securities included in, or representative of, its Index regardless of their investment merit and the Fund does not attempt to outperform its Index. The composition of the Index is governed by an Index Committee and the Index may not perform as intended. Please read the Fund’s prospectus for specific details regarding the Fund’s risk profile.
For additional fund disclosures, click the respective ticker: IWD, IWF.

Global Head of Research
Christopher Gannatti began at WisdomTree as a Research Analyst in December 2010, working directly with Jeremy Schwartz, CFA®, Director of Research. In January of 2014, he was promoted to Associate Director of Research where he was responsible to lead different groups of analysts and strategists within the broader Research team at WisdomTree. In February of 2018, Christopher was promoted to Head of Research, Europe, where he was based out of WisdomTree’s London office and was responsible for the full WisdomTree research effort within the European market, as well as supporting the UCITs platform globally. In November 2021, Christopher was promoted to Global Head of Research, now responsible for numerous communications on investment strategy globally, particularly in the thematic equity space. Christopher came to WisdomTree from Lord Abbett, where he worked for four and a half years as a Regional Consultant. He received his MBA in Quantitative Finance, Accounting, and Economics from NYU’s Stern School of Business in 2010, and he received his bachelor’s degree from Colgate University in Economics in 2006. Christopher is a holder of the Chartered Financial Analyst Designation.


