

Not All Value Indexes Are Created Equal: Russell vs. S&P
Published August 13, 2025

Equity Strategist
Key Takeaways
- As of August 2025, the Russell 1000 Value Index outperformed the S&P 500 Value Index by 2.5% year-to-date, driven largely by its exposure to companies absent from the S&P benchmark.
- Methodology differences, especially Russell's penalization of forecasted earnings growth and S&P’s relative peer scoring, create significant divergence in holdings and performance between these two flagship value indexes.
- Investors allocating to U.S. value strategies must look under the hood, as more than 30% of index weight can be unique between Russell and S&P value benchmarks, leading to materially different outcomes.
Not all U.S. value portfolios are created equal. Many are methodology-dependent allocations that produce exposures drastically different from one another, despite being nominally branded as value. Their resulting discrepancies are especially pronounced today, potentially amplifying performance deviations for investors disregarding, or misinterpreting, their composition.
Dissecting the Russell 1000 Value & S&P 500 Value Indexes
A simple overlap analysis of two of the largest, and perhaps most followed, U.S. value indexes clearly illustrates their contrasts.
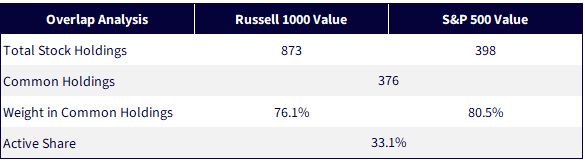
Figure 1: Overlap Analysis
Sources: WisdomTree, Russell, S&P, as of 7/31/25. You cannot invest directly in an index. For definitions of terms in the table above, please visit the glossary.
The Russell 1000 Value Index contains 873 holdings, representing 86% of the total companies that make up its parent, the Russell 1000 Index. This is not unusual, as the S&P 500 Value contains 398 of the 504 companies in the flagship S&P 500 Index, or about 79% itself. Between the two, the total weight in common holdings is understandably about 75% to 80%.
But one-third of the weight between each index is entirely unique to the exposures provided by the other, and the company-level weights uncover the greater disparities between these two hallmark value approaches.
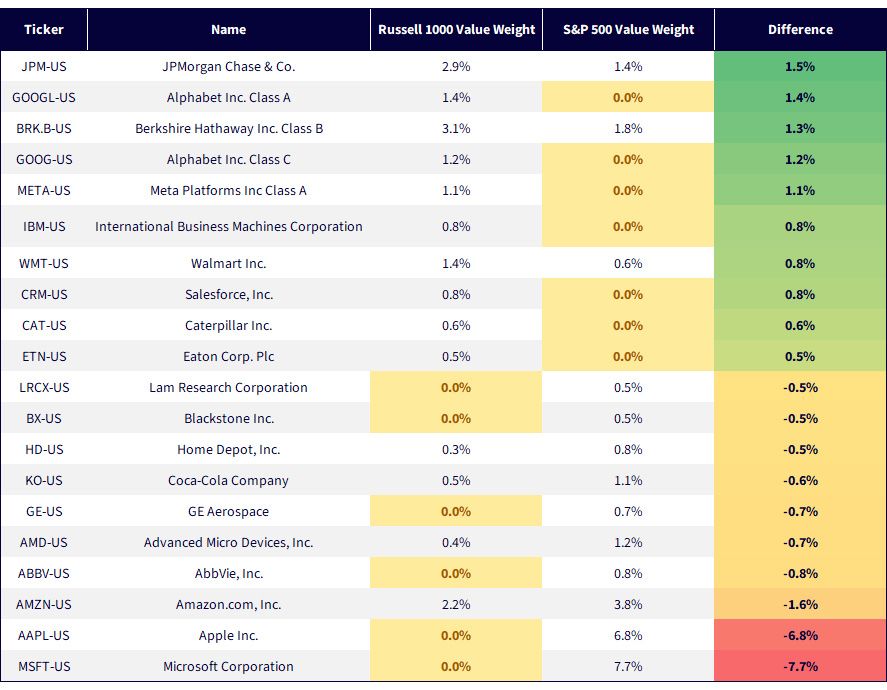
Figure 2: Russell 1000 Value vs. S&P 500 Value—Top 10 Over-Weights and Under-Weights
Sources: WisdomTree, Russell, S&P, as of 7/31/25. You cannot invest directly in an index.
There are 895 unique companies between both indexes. If we examine the top 10 relative over-weights and under-weights across these names, we find that 11 of them correspond to a company held in one index but not the other. This has serious implications for investor performance when benchmarking to these value methodologies. Here are the highlights:
- The three deepest under-weights for the Russell 1000 Value correspond to companies in the Magnificent 7: Amazon, Apple and Microsoft. The latter two are held in the S&P 500 Value yet absent from the Russell 1000 Value. Amazon is a common holding, although the Russell 1000 Value is 1.6% under-weight. The cumulative underexposure in these three names exceeds 16%.
- At the other end of the spectrum are two Magnificent 7 names that the Russell 1000 Value does hold. Alphabet's two share classes, together with Meta, make up 3.7% of the Russell 1000 Value Index, producing a corresponding under-weight in the S&P 500 Value due to their absence.
- Among the 11 names (in the universe of top 10 over-weights and under-weights unique to one index only), the Russell 1000 Value is net 11% under-weight in aggregate versus the S&P 500 Value. (It is about 18% under-weight the top names it does not own from this list and 6.4% over-weight the names that the S&P 500 Value does not own.)
If it sounds difficult to follow, that is because it is. Many investors would be surprised to learn that these two value indexes have disparate exposures to the largest companies that have recently been most impactful to equity markets.
But it is less surprising when you consider the methodology differences that affect their construction.
Index Construction: Looking Under the Hood
Intuitively, both indexes identify and select stocks with value characteristics from their respective style-agnostic parent indexes. The Russell 1000 Value samples from the Russell 1000, while the S&P 500 Value selects from the S&P 500. Notably, the Russell 1000 universe is about twice the size of the S&P 500 in terms of eligible companies.
The two methodologies diverge from there.
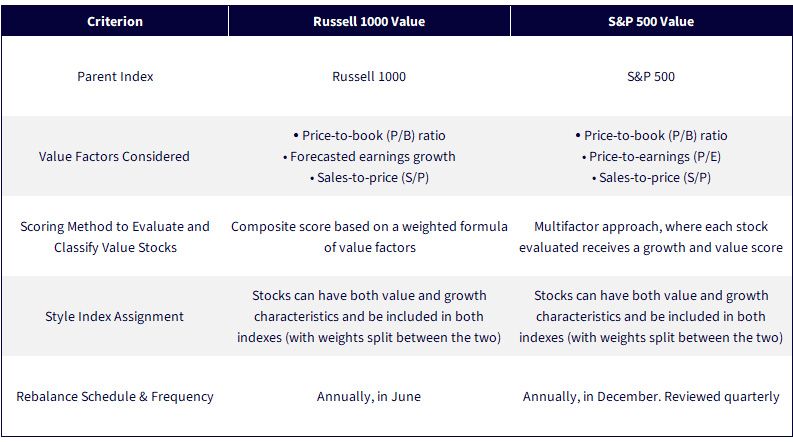
Figure 3: Methodology Comparison
For definitions of terms in the table above, please visit the glossary.
The Russell 1000 Value considers one factor that the S&P 500 Value does not when classifying value stocks, which is also unique in perspective.
Forecasted earnings growth is traditionally used to evaluate companies with growth potential (and to correspondingly classify them as growth) based on their future business prospects. Russell penalizes high-earnings-growth companies in its value analysis, which intuitively categorizes companies with slower earnings growth forecasts as value.
The other factors considered between both indexes are all backward-looking and based on trailing accounting data. Note that S&P's methodology substitutes this metric for a price-to-earnings (P/E) ratio evaluation, which is a traditional instrument assessed in style analysis.
The biggest difference between the two, however, relates to scoring and assignment.
The Russell 1000 Value uses a weighted formula that can result in its constituents having value and growth characteristics. The weights assigned to each of the value factors evaluated remain fixed, and the style determination is based on the absolute score from that formula (with no adjustment for scores among peers in the eligible universe).
Partial style overlap is allowed, meaning a stock can be held in both Russell 1000 Value and Growth indexes, with its weight split between the two if it does not score high enough in the value assessment.
The S&P 500 Value, however, evaluates stock style compared to the eligible universe. Specifically, the measurements are normalized among peers and then averaged to generate a value score and a growth score. (The growth assessment considers other parameters not mentioned here.)
Style overlap is allowed in the S&P methodology as well and is based on the relative difference between the two scores. If both scores are high, however, the stock may also appear in both indexes with weights split based on the ratio of those scores.
Performance Attribution
These variations produce performance discrepancies that are visible year-to-date. Through August 5, 2025, the Russell 1000 Value Index gained 6.2% and outperformed the S&P 500 Value Index by 2.5%.
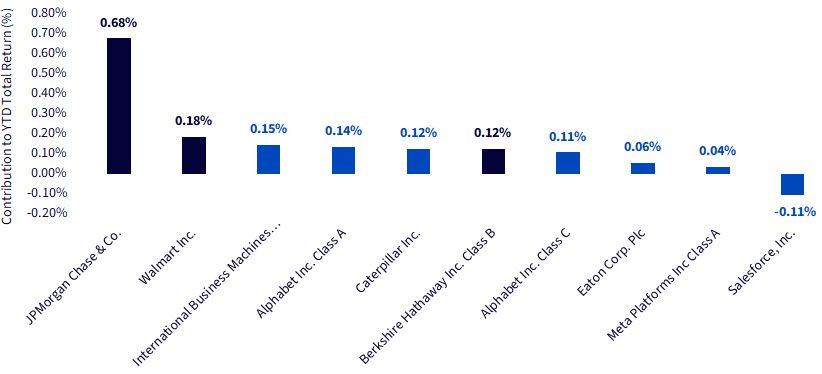
The top 10 over-weights account for about 150 basis points (bps) of that 6.2%, or roughly 25% of the year-to-date total. Notably, Salesforce is the only company over-weighted versus the S&P 500 Value that has been detrimental to performance in 2025.
Figure 4: Russell 1000 Value: Contributions to YTD Total Return Among Top 10 Over-Weights vs. S&P 500 Value
Sources: WisdomTree, FactSet, as of 8/5/25. Past performance is not indicative of future results. You cannot invest directly in an index. Blue bars indicate companies that are not held altogether in the S&P 500 Value Index.
Seven of these 10 names are not held by the S&P 500 Value altogether, producing a cumulative contribution of 50 bps or about 8% of the year-to-date gain.
Reversing the analysis relates the performance impact of the S&P 500 Value's top 10 over-weights versus the Russell 1000 Value.
Figure 5: S&P 500 Value: Contributions to YTD Total Return Among Top 10 Over-Weights vs. Russell 1000 Value
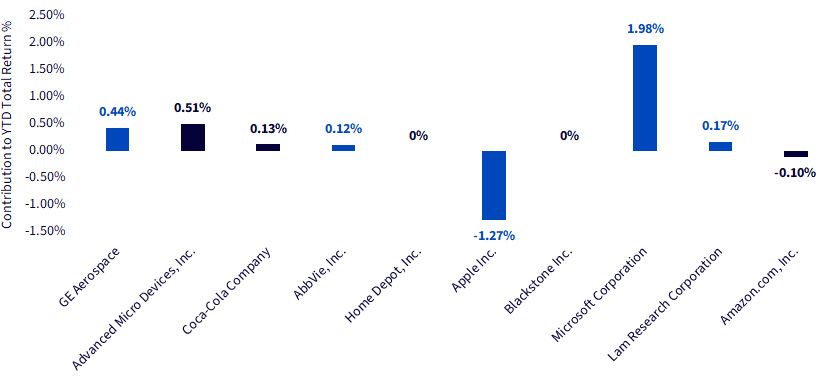
Sources: WisdomTree, FactSet, as of 8/5/25. Past performance is not indicative of future results. You cannot invest directly in an index. Blue bars indicate companies that are not held altogether in the Russell 1000 Value Index.
These 10 added nearly 200 bps of positive performance to the 3.69% year-to-date return for the S&P 500 Value through August 5, which is more than 50% of the total gain.
The six names that are not held altogether in the Russell 1000 Value Index had the most pronounced effect. They provided nearly 140 bps of positive performance, which is almost 40% of the year-to-date return. This is much more impactful than the earlier effect observed among names held in the Russell 1000 Value but not in the S&P 500 Value, which exhibited a relatively benign impact on the former's performance.
Conclusion
The methodology differences between these two indexes result in different "flavors" of value that generate meaningful performance differences. As a result, appropriately benchmarking your U.S. value allocations is essential to your portfolio's success. Understanding what these value indexes are exposed to, and how they are constructed, is essential for a comprehensive performance evaluation. Likewise, it may help investors identify and execute their preferred strategies as part of their overall financial plans.
Categories
About the contributor

Equity Strategist
Brian Manby is an Equity Strategist at WisdomTree and part of the Investment Strategy team.
He is responsible for developing and communicating equity market insights, investment themes, and portfolio strategies that support the firm’s ETF and investment solutions platform. He evaluates sectors, valuations, fundamentals and equity styles to identify investment opportunities and provide actionable perspectives to clients and advisors. He also helps investors understand how WisdomTree’s equity strategies can be used to achieve long-term investment objectives in evolving market environments.
Brian joined WisdomTree in October 2018 as an Investment Strategy Analyst after a few years as a Consultant for FactSet Research Systems, Inc. He earned a B.A. in Economics and Political Science from the University of Connecticut in 2016 and has been a Chartered Financial Analyst since 2022.