
DGRW
U.S. Quality Dividend Growth Fund

Published February 12, 2025

Head of Equity Strategy
Figure 1 marks all the months that witnessed the ISM PMI cross above 50 since WisdomTree launched ETFs in 2006. For example, in the first row, manufacturing made a move into expansion in summer 2008, as hard as that is to believe. The PMI had been in the 48–49 range for five months before it went to 50.8 that July. We know, in retrospect, that it would be just a few more months before Lehman would collapse.
Nevertheless, the best-performing ETF for the subsequent 12 months was EPS (full Fund names are listed at the bottom of the blog post). EPS is our earnings-weighted strategy that feels a lot like the S&P 500.
Figure 1: A Crossover above50 Was Good for EPS
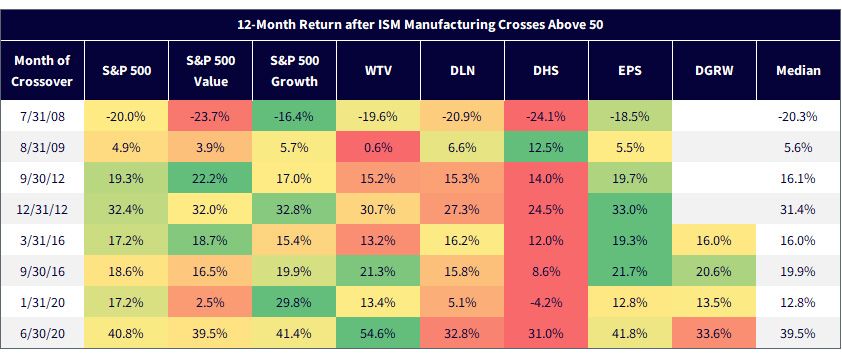
Source: Refinitiv, as of 12/31/24. Month of crossover are the months that witnessed the ISM PMI go from some figure less than 50.0 to some figure above it. The median is a midpoint of a frequency distribution. The S&P 500 Growth and Value indexes measure constituents from the S&P 500 that are classified as growth stocks and value stocks, respectively.
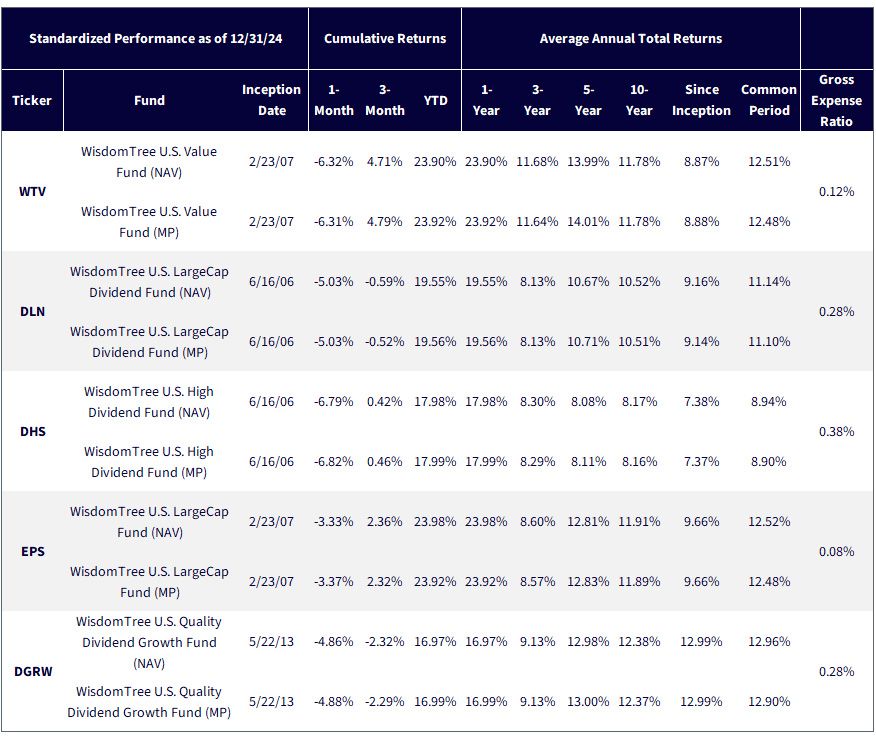
Source: WisdomTree, as of 3/26/25. NAV denotes total return performance at net asset value. Common period refers to the period from 5/31/13 - 12/31/24. Past performance is not indicative of future results. Investment return and principal value of an investment will fluctuate so that an investor's shares, when redeemed, may be worth more or less than their original cost. Current performance may be lower or higher than the performance data quoted. For the most recent month-end and standardized performances, click the respective ticker: WTV, DLN, DHS, EPS, DGRW.
Beyond two of our crossover dates occurring during the global financial crisis, another one occurred in the thick of a society-wide lockdown, so we have to take some of this rearview mirror stuff with a grain of salt. Another thing to consider: the Funds' sector mixes change through the years, so keep that in mind too.
Let's look at the sector heat maps after the PMI crossovers into expansion territory. Figure 3 shows each sector's performance over the subsequent 12 months.
Figure 3: Manufacturing Contraction-to-Expansion Crossovers
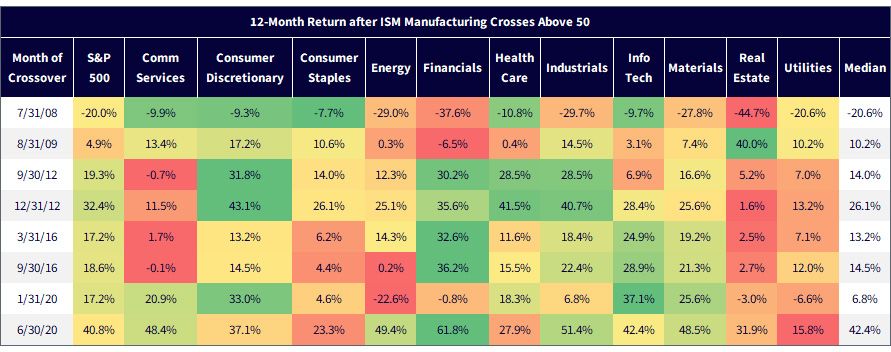
Source: Refinitiv, as of 12/31/24.
Eyeball it for green color-coding. Maybe we can conclude that the "good" sectors are Consumer Discretionary, Financials, Industrials, Info Tech and Materials.
Notice my strategic use of the word "maybe." There is a major proviso.
I've bucketed Tech as a good sector for manufacturing recoveries. But remember that the dataset is the time from when we launched ETFs in June 2006 to today. Hasn't Tech basically always been a good sector in that time window? Maybe it had nothing to do with manufacturing and everything to do with, say, Ben Bernanke, Janet Yellen and Jay Powell. Who knows?
To wit, of the 211 monthly rolling periods starting June 2007 (12 months after our initial launches) through December 2024, Tech was a winning sector in 172 of them, with a hit rate of 81.5%.
In other words, I'm running a screen for a manufacturing comeback; history would seemingly conclude that Tech is a beneficiary, when in reality it was just an all-weather sector.
Now, let's sum up the "generally good" sectors—with that Tech asterisk in our minds as we do it.
The two tickers that pick up the good sectors are a large-cap growth Fund (QGRW)—because of all that Tech—and also the buybacks-plus-dividends Fund, (WTV), which has big quantities in the other desired sectors (figure 4).
Figure 4: Fund Weights in the "Generally Good" Sectors
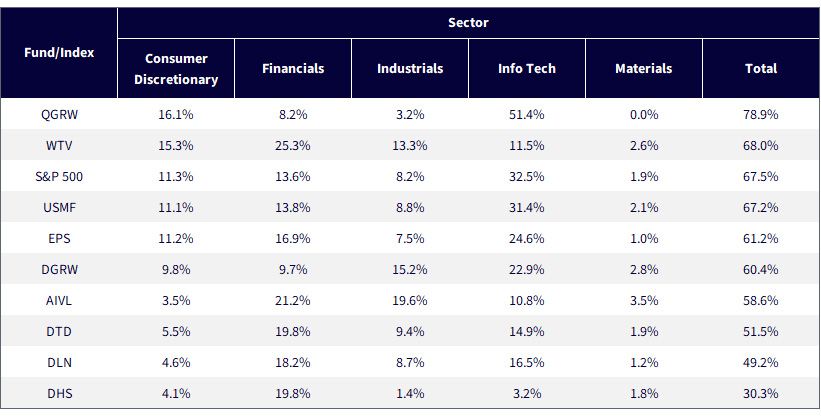
Source: WisdomTree Path Software. Sector and index weights as of 1/31/25.
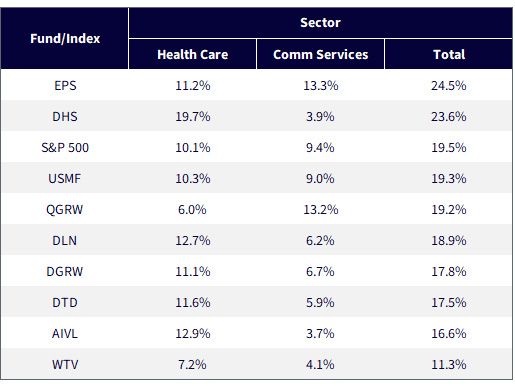
I'm going to call two sectors neutral, or maybe "sometimes good, sometimes bad." They are Health Care and Communication Services.
Figure 5: Weights in the Neutral Sectors
Source: WisdomTree Path Software. Sector and index weights as of 1/31/25.
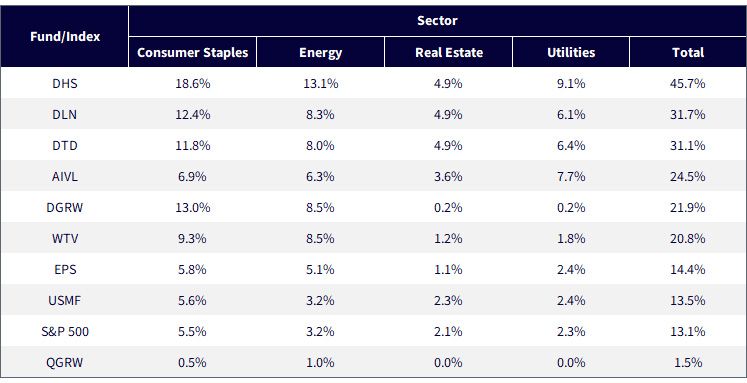
Finally, the "generally bad" sectors. A lot of the red and orange shading was in Consumer Staples, Energy, Real Estate and Utilities. On this score, QGRW and our multi-factor concept, USMF, are scoring well.
Figure 6: Weights in the "Generally Bad" Sectors
Source: WisdomTree Path Software. Sector and index weights as of 1/31/25.
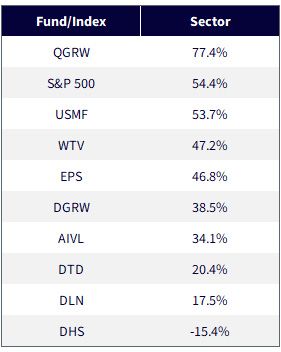
Logic says we should net out the generally good from the generally bad. Again, I keep coming back to the proviso that Tech was a great sector, in the past tense. If we subtract the weight in the bad sectors from the weight in the good sectors, the math points to QGRW and USMF.
Figure 7: Weight in Generally Good Sectors Minus Weight in Generally Bad
Source: WisdomTree Path Software. Sector and index weights as of 1/31/25.
Some final observations.
In the sector heat map, I will never be able to know each reader's mindset, so let's go through some scenarios.
Something that pops out to me is the distinct possibility that the first two rows—2008 and 2009—could have a line drawn through them by 99% of you. I just don't think a lot of people who are reading this think that JP Morgan or Bank of America are going to go insolvent in 2025 à la Lehman.
The other one I could see someone drawing a line through is Covid. The whole thing was so bizarre and probably not part of many 2025 forecasts. Maybe that person gives a ding to Consumer Discretionary and eases up the bearishness on Real Estate, for example.
Here are five approaches for five different reader profiles:
The Fund Names
WTV: WisdomTree U.S. Value Fund
DGRW: WisdomTree U.S. Quality Dividend Growth Fund
QGRW: WisdomTree U.S. Quality Growth Fund
DLN: WisdomTree U.S. LargeCap Dividend Fund
EPS: WisdomTree U.S. LargeCap Fund
USMF: WisdomTree U.S. Multifactor Fund
DTD: WisdomTree U.S. Total Dividend Fund
DHS: WisdomTree U.S. High Dividend Fund
AIVL: WisdomTree U.S. AI Enhanced Value Fund
There are risks associated with investing, including the possible loss of principal. Funds focusing their investments on certain sectors increase their vulnerability to any single economic or regulatory development. This may result in greater share price volatility. Dividends are not guaranteed, and a company currently paying dividends may cease paying dividends at any time. Please read each Fund’s prospectus for specific details regarding the Fund’s risk profile.

Head of Equity Strategy
Jeff Weniger, CFA, has been with WisdomTree since 2017 and serves as the Head of Equities. He shapes the firm’s market outlook through a combination of macroeconomic and fundamental analysis. With more than two decades in investment strategy, Jeff is known for his work on market cycles and valuations. Before joining WisdomTree, Jeff was with BMO Private Bank and BMO Global Asset Management for 11 years. At BMO, he sat on the firm’s Asset Allocation Committee and co-managed ETF model portfolios across the U.S. and Canada. In 2013, at age 32, he became the youngest member of BMO’s Global Investment Forum. When he left BMO to come to WisdomTree, his final role was Director, Senior Strategist in the Office of the CIO in 2017.
Jeff is a frequent television guest on networks such as CNBC, Bloomberg, and Schwab, with regular print appearances in The Wall Street Journal, Barron’s and Reuters. He also appears weekly on the Behind the Markets podcast and is a regular on SiriusXM’s The Business Briefing. On X, Jeff has developed one of the larger followings in financial media. He earned a B.S. in Finance from the University of Florida and an MBA from the University of Notre Dame. He has held the CFA charter since 2006.