EPI
India Earnings Fund

Published May 4, 2026

Global Head of Research

Director of Market Strategy
“Be fearful when others are greedy, and greedy when others are fearful.” — Warren Buffett1
At WisdomTree, Contrarian Corner exists for exactly the moments Buffett is describing: those stretches when investor sentiment has moved so far in one direction that the data itself starts to tell a different story. We look for the gap between what the crowd is doing and what history suggests often follows. Today, that gap has opened up in India, and we think it is worth examining closely.
Not long ago, India was the investment world’s favorite emerging market. In 2024, the narrative was nearly impossible to resist:2
In the first half of 2024 alone, more than $4.7 billion flowed into India-focused exchange-traded funds (ETFs), and nearly $1 billion in June alone.3 Strategists were calling for 20% returns over the following twelve months.4 The consensus was not just bullish on India; it treated an allocation as obligatory.
Then came the pullback. Foreign investors began to reassess.
The same crowded positioning that had amplified the rally on the way up began to amplify the selling on the way down.
This is a pattern markets have seen before. Strong narratives tend to peak near price peaks, and the deepest skepticism often arrives after the bulk of the correction has already occurred. That does not make the current environment comfortable. But it does make it interesting, which brings us to the data.
To understand what investors are actually doing in India, not what they are saying, we look at fund flows. Specifically, we track flows in and out of India equity ETFs as a Morningstar category. We also want to introduce the WisdomTree India Earnings Fund (EPI), which is designed to track a very broad range of India’s equity market of specifically profitable companies.5 EPI launched in February 2008, which means it has a longer live track record in India equity exposure than nearly any comparable vehicle.
In effect, the Morningstar category is useful for gauging flows and EPI is useful, with its long track record and extremely broad construction, in showing performance after those periods of extreme flows.
To put the current environment in context, consider what a normal month of outflows looks like in the Morningstar India ETF category. Across the past decade, months in which investors were net sellers averaged roughly $193 million in redemptions for the 30-day window. That is not pocket change, but markets absorb that kind of movement without much drama. Every month is different, of course; some months see heavier selling, others lighter. The typical variation around that average, the standard deviation, in statistical terms, gives us a sense of the normal range of outcomes.
What we have seen recently is not within that normal range. Not even close.6
To appreciate what those numbers mean relative to history, consider this:
The current 30-day outflow is running at roughly five times the magnitude of a standard deviation around the historical average. The 60-day figure is approaching six times.
In other words, what we are seeing today is not a bad month. It is an event, and one that sits in territory the India ETF category has not visited in the decade of data we have examined.
The question that follows naturally from this is: what has historically happened after periods of extreme redemptions?
We went back through ten years of EPI performance data, from April 2016 through February 2026, and identified every month in which investors were net sellers. We then calculated the average forward returns for EPI over the subsequent six months, one year, and three years. The results across all redemption periods were already encouraging: average one-year forward returns in the range of 15%, and average three-year annualized returns near 13%.
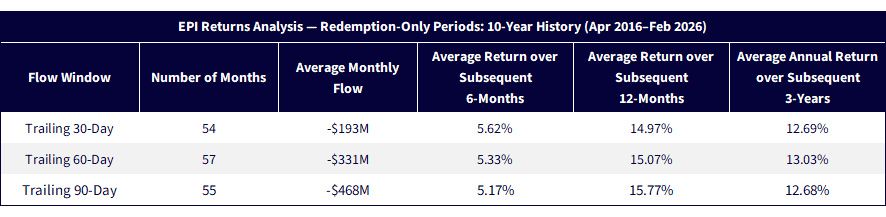
Source: WisdomTree. Based on Morningstar India Equity Category morning flow data and EPI monthly performance data, April 2016–February 2026. EPI performance is shown in net asset value (NAV) total return terms. Standardized performance as of March 31, 2026 for EPI will be shown at the end of this piece. Past performance is not indicative of future results.
But the more important finding emerges when we isolate the extreme episodes, defined as the months where outflows from the Morningstar India Equity category were not just negative, but severely so. When we segment by the magnitude of outflows and look only at the most stressed periods (those registering more than twice the typical standard deviation of redemptions), the forward return picture improves meaningfully.
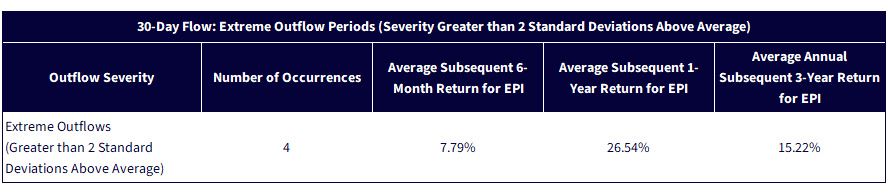
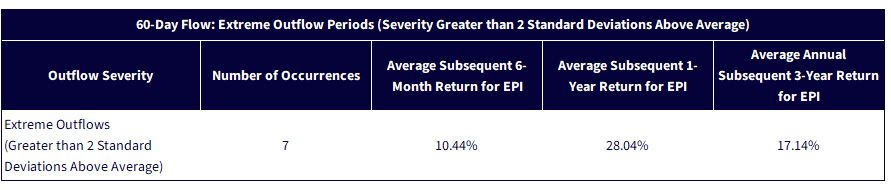
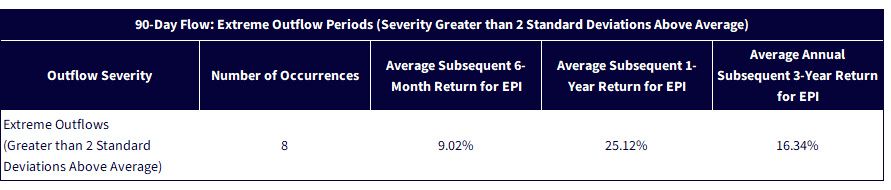
Source: WisdomTree. Based on Morningstar India Equity Category morning flow data and EPI monthly performance data, April 2016–February 2026. EPI performance is shown in net asset value (NAV) total return terms. Standardized performance as of March 31, 2026 for EPI will be shown at the end of this piece. Past performance is not indicative of future results.
The pattern is consistent across all three windows, seen in Figures 2a-2c. When selling in India ETFs has historically reached the level of severity we are seeing today, forward returns over the following year, for EPI, have averaged between 25% and 28%. Three-year annualized returns for EPI have averaged between 15% and 17%.
We want to be clear that these are small samples, and note the most extreme outflow episodes are rare by definition. There is no way to know for sure if these same relationships will persist, and past flows do not guarantee future performance.
But we think that the direction of the signal, and its consistency across time windows, is difficult to ignore.
Flow data tells us about sentiment. It does not, by itself, tell us whether the underlying investment case remains sound. For that, we turn to the fundamentals, and here, the picture remains constructive.
India continues to be the fastest-growing major economy in the world by a significant margin. The IMF projects GDP growth of 6.4% for both 2026 and 2027, roughly double the projected pace of global growth overall. That gap matters: it means India is compounding its economic base at a rate that few peers can match, and that the structural drivers of that growth, a young workforce, rising urbanization, expanding domestic consumption, and ongoing investment in infrastructure and manufacturing, remain firmly in place.7
From a valuation standpoint, the correction has done meaningful work. We would also note that EPI's underlying strategy focuses on the profitable companies of India and weights those companies on the basis of the profits that they generate. Approaching an equity market in this manner, as opposed to through weighting by market capitalization, tends toward a lower valuation exposure, particularly if one is looking at the price-to-earnings (P/E) ratio.
For those investors where the valuation of India’s equity market is a potential concern, EPI's approach warrants consideration.
Markets are rarely cheapest when they feel safe. The moments that, in retrospect, offered the best entry points have almost always felt uncomfortable in real time, because the crowd was still moving in the opposite direction. That is the nature of contrarian investing, and it is why we built this column.
The data we have presented here does not tell you that India will deliver a specific return over the next twelve months. What it does suggest is that the combination now visible, historically extreme outflows, a fundamental backdrop that remains intact, and valuations that have reset from stretched to reasonable, has been a meaningful signal in the past. The visitors, as they say, have left. The question is whether this is the end of the story, or the beginning of the next chapter.
At WisdomTree, we believe it is the latter. And we believe the data supports that view.
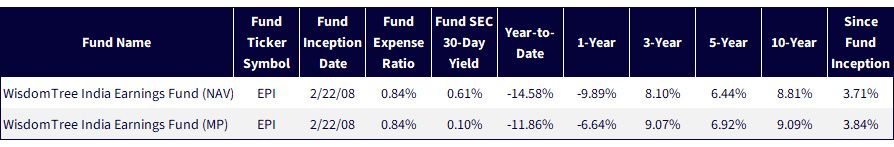
Sources: Morningstar, FactSet and WisdomTree, specifically data is from the PATH Fund Comparison Tool, accessed as of April 20, 2026, but showing returns for the period ended March 31, 2026. NAV denotes total return performance at net asset value. MP denotes market price performance. Past performance is not indicative of future results. Investment return and principal value of an investment will fluctuate so that an investor’s shares, when redeemed, may be worth more or less than their original cost. Current performance may be lower or higher than the performance data quoted. For the most recent month-end and standardized performance, click here.
Source: Buffett, W. E. (1987). Chairman’s letter to shareholders (1986). Berkshire Hathaway Inc.
Source: International Monetary Fund. (2024). World economic outlook: Steady but slow—Resilience amid divergence. International Monetary Fund.
Sources: Jackson, R. (2024, July 5). A prolific first half for ETF flows. Morningstar; Alvim, L. (2024, July 1). India ETFs lead inflows in June on growth optimism post-election. Bloomberg. (via NDTV Profit / syndicated coverage).
Source: Morgan Stanley. (2024). India’s election: What it means for the economy and markets. Morgan Stanley Research.
EPI is designed to track the total return performance of, before fees and expenses, the WisdomTree India Earnings Index. This index requires every constituent to have generated positive profits prior to inclusion, and weighting in the index is based on profits, not market capitalization.
Source for fund flow data: Morningstar, specifically the ETFs within the India Equity category.
Source: International Monetary Fund. (2025). World economic outlook: A critical juncture amid policy shifts. International Monetary Fund.
There are risks associated with investing, including possible loss of principal. Foreign investing involves special risks, such as risk of loss from currency fluctuation or political or economic uncertainty. This Fund focuses its investments in India, thereby increasing the impact of events and developments associated with the region, which can adversely affect performance. Investments in emerging, offshore or frontier markets such as India are generally less liquid and less efficient than investments in developed markets and are subject to additional risks, such as risks of adverse governmental regulation and intervention or political developments. The Fund invests in the securities included in, or representative of, its Index regardless of its investment merit and the Fund does not attempt to outperform its Index. The composition of the Index is governed by an Index Committee and the Index may not perform as intended. Please read the Fund’s prospectus for specific details regarding the Fund’s risk profile.
India Earnings Fund

Global Head of Research
Christopher Gannatti began at WisdomTree as a Research Analyst in December 2010, working directly with Jeremy Schwartz, CFA®, Director of Research. In January of 2014, he was promoted to Associate Director of Research where he was responsible to lead different groups of analysts and strategists within the broader Research team at WisdomTree. In February of 2018, Christopher was promoted to Head of Research, Europe, where he was based out of WisdomTree’s London office and was responsible for the full WisdomTree research effort within the European market, as well as supporting the UCITs platform globally. In November 2021, Christopher was promoted to Global Head of Research, now responsible for numerous communications on investment strategy globally, particularly in the thematic equity space. Christopher came to WisdomTree from Lord Abbett, where he worked for four and a half years as a Regional Consultant. He received his MBA in Quantitative Finance, Accounting, and Economics from NYU’s Stern School of Business in 2010, and he received his bachelor’s degree from Colgate University in Economics in 2006. Christopher is a holder of the Chartered Financial Analyst Designation.

Director of Market Strategy
Jonathan Flynn serves as Director of Market Strategy at WisdomTree, helping bridge research, product strategy, distribution and investor engagement through data-driven market insights and thematic storytelling.
He brings more than 25 years of experience working with leading wealth management teams and advisors, with deep expertise in investor behavior, ETF trends, market flows and behavioral finance. Jonathan specializes in identifying emerging themes early, translating complex ideas into compelling investment narratives and helping investors better understand the intersection of sentiment, positioning and long-term opportunity.
His work is grounded in the belief that understanding investor behavior and crowd dynamics can help uncover tomorrow’s investment opportunities before they become consensus.
