WTV
U.S. Value Fund

Published October 2, 2025

Global Head of Research
The past 18 months have delivered a masterclass in market whiplash. The growth style of U.S. equities dominated 2023 and 2024 as artificial intelligence (AI)-fueled optimism and mega-cap leadership drove strong returns, to the point of coining the term ‘Magnificent 7'1 to describe seven large companies. To make it crystal clear:
In early 2025, however, the pendulum swung violently in the opposite direction when tariff shocks and policy uncertainty triggered a broad sell-off. For a moment, value exposures looked poised for resurgence. Yet within weeks, markets lurched back to risk-on mode, restoring growth's leadership almost as quickly as it had been questioned. To put numbers to it3:
This back-and-forth has left investors grappling with a difficult question: should they chase whichever style regime seems ascendant or attempt to forecast the next rotation? Style leadership can flip on macroeconomic headlines as much as on fundamentals, and attempts to time the turns often leave portfolios exposed at precisely the wrong moment. The April 2025 episode was instructive: investors who leaned entirely into either growth or value found themselves on the wrong side of at least part of the cycle.
That is why a blended approach, anchored in both quality growth and resilient value, has gained importance. At WisdomTree, for those seeking a core U.S. equity strategy, we have:
With a 50/50 blend of these strategies, investors can construct a core that aims to sidestep the need for perfect timing. Growth holdings capture the structural forces reshaping the economy as well as AI adoption, digital transformation and earnings momentum. At the same time, value holdings bring ballast through shareholder yield, cash flow strength and cyclical participation. Together, they create a portfolio that can help absorb rotation shocks without being defined by them.
As of September 2025, the lesson is clear: markets are rewarding adaptability, not purity. Concentrated bets on a single style may still deliver bursts of outperformance, but they come with stomach-churning volatility and frequent reversals. A core built on the complementary strengths of QGRW and WTV seeks to offer something different: a disciplined way to harness innovation while maintaining resilience through fundamentals. In an era of style rotation whiplash, balance is not a compromise, it is a strategy for durability.
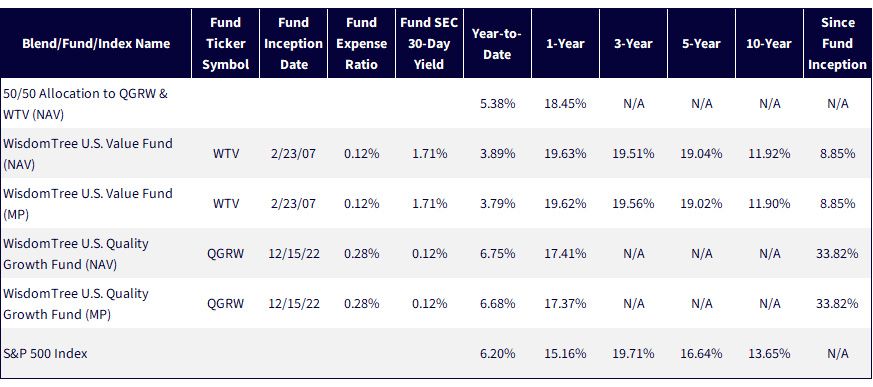
Sources: WisdomTree, Morningstar, FactSet, specifically data from the Fund Comparison Tool in the PATH suite of tools, accessed 9/8/25 with returns as of 6/30/25. NAV denotes total return performance at net asset value. MP denotes market price performance. In the case of WTV, the Fund's objective changed effective 12/18/17. Prior to 12/18/17, Fund performance reflects the investment objective of the Fund when it tracked the performance, before fees and expenses, of the WisdomTree U.S. LargeCap Value Index. The performance data quoted represents past performance and is not indicative of future results. Investment return and principal value of an investment will fluctuate so that an investor's shares, when redeemed, may be worth more or less than their original cost. Current performance may be lower or higher than the performance data quoted. For the most recent month-end and standardized performance, click the relevant ticker: QGRW, WTV.
Figure 2: The Balance that Beat the Benchmark
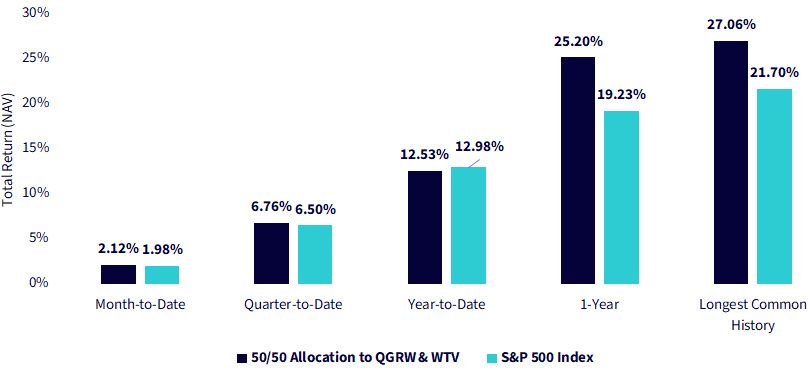
Sources: WisdomTree, Morningstar, FactSet, specifically data from the Fund Comparison Tool in the PATH suite of tools, accessed 9/14/25 with returns as of 9/12/25. NAV denotes total return performance at net asset value. The Longest Common Period is constrained by the inception of QGRW. In the case of WTV, the Fund's objective changed effective 12/18/17. Prior to 12/18/17, Fund performance reflects the investment objective of the Fund when it tracked the performance, before fees and expenses, of the WisdomTree U.S. LargeCap Value Index. The performance data quoted represents past performance and is not indicative of future results. Investment return and principal value of an investment will fluctuate so that an investor's shares, when redeemed, may be worth more or less than their original cost. Current performance may be lower or higher than the performance data quoted. For the most recent month-end and standardized performance, click the relevant ticker: QGRW, WTV.
Figure 3, showing one-year rolling returns, tells a story of consistency with nuance: the 50/50 allocation to QGRW and WTV (blue line) has generally tracked the S&P 500 (black line) closely, but with a modest return advantage during most periods. Both series exhibit the same cyclical rhythm, peaking near 40%–45% rolling returns in late 2024, then dipping sharply into early 2025 before recovering steadily into mid-2025. The allocation's persistent edge, even through drawdowns, underscores how blending quality growth and value tilts can smooth performance and maintain a consistency advantage relative to the market benchmark.
Figure 3: Rolling 1-Year Returns: Consistency with an Edge over the S&P 500 Index
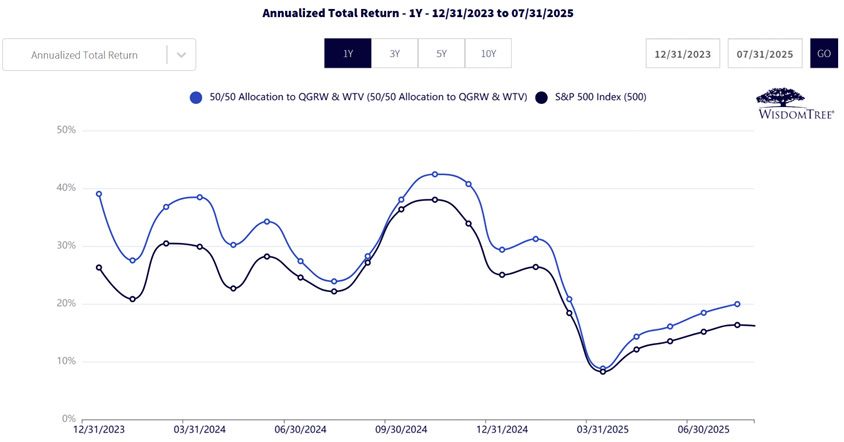
Sources: WisdomTree, Morningstar, FactSet, specifically data from the Fund Comparison Tool in the PATH suite of tools, accessed 9/14/25 with returns as of 7/31/25. NAV denotes total return performance at net asset value. The Longest Common Period is constrained by the inception of QGRW. In the case of WTV, the Fund's objective changed effective 12/18/17. Prior to 12/18/17, Fund performance reflects the investment objective of the Fund when it tracked the performance, before fees and expenses, of the WisdomTree U.S. LargeCap Value Index. The performance data quoted represents past performance and is not indicative of future results. Investment return and principal value of an investment will fluctuate so that an investor's shares, when redeemed, may be worth more or less than their original cost. Current performance may be lower or higher than the performance data quoted. For the most recent month-end and standardized performance, click the relevant ticker: QGRW, WTV.
The allocation's sector and stock-level exposures highlight a key point: while there are notable differences compared to the S&P 500 Index, they stop short of being outsized bets. The 50/50 blend of QGRW and WTV, as seen in figure 4a, leans slightly less into Information Technology overall, with more balanced representation in areas like Consumer Discretionary and Financials. At the stock level, as seen in figure 4b, this translates into lighter weights in mega-cap names like Nvidia and Microsoft, though those companies remain core holdings. These distinctions show a conscious effort to diversify rather than concentrate risk, while still keeping the portfolio's largest drivers aligned with the benchmark.
For investors, this positioning offers familiarity without mimicry. Many market participants critique the S&P 500 for its concentration in a handful of technology giants, but they're also hesitant to deviate too far from it, since moving drastically away can trigger discomfort or tracking error concerns. The QGRW/WTV blend strikes a middle ground: recognizable sector and stock exposures that closely resemble the benchmark, but with subtle tilts that emphasize quality growth and value factors. In other words, the portfolio is differentiated enough to add potential value, yet not so different that it risks alienating benchmark-sensitive investors.
Figure 4a: Balanced Sector Positioning Relative to the Benchmark
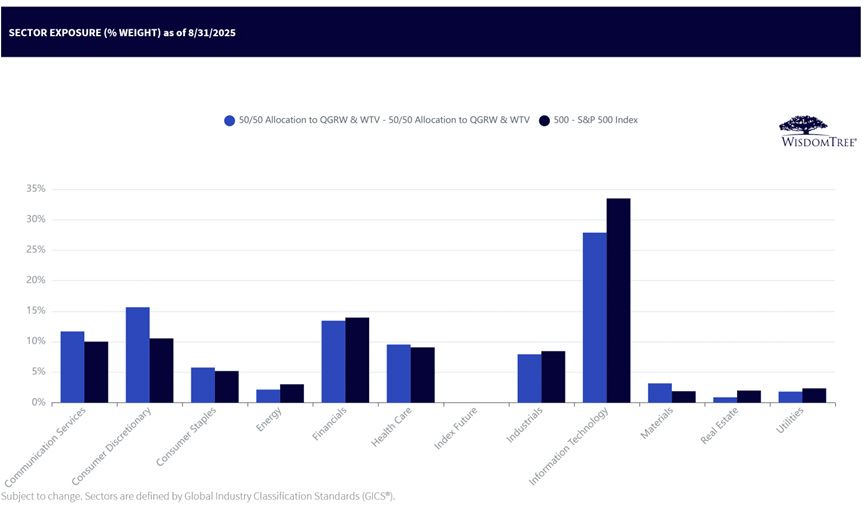
Sources: WisdomTree, FactSet, with data as of 8/31/25. Subject to change.
Figure 4b: Top 10 Holdings: Similar Foundations, Subtly Different Weights
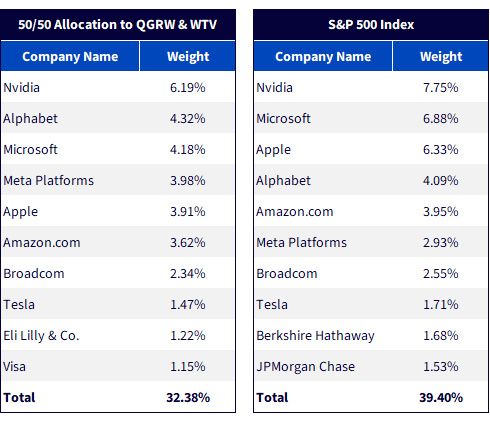
Sources: WisdomTree, FactSet, with data as of 7/31/25. Subject to change.
Conclusion: Balanced Positioning for Investors Who Value both Alignment and Edge
In conclusion, the 50/50 blend of QGRW and WTV delivers what many investors seek but rarely find: alignment with the comfort of the S&P 500 benchmark, paired with thoughtful, incremental differentiation. The sector and stock-level exposures show familiar leadership, anchored by the same mega-cap names, but with subtle adjustments that reduce concentration risk without introducing undue tracking error. Rolling returns underscore this balance, demonstrating a pattern of consistency with a modest performance edge. For investors, the result is a portfolio that potentially feels close enough to the benchmark to inspire confidence, yet different enough to matter in driving long-term outcomes.
1 Refers to Alphabet, Amazon, Apple, Microsoft, Meta Platforms, Nvidia and Tesla.
2 Sources: WisdomTree, FactSet, with data from 1/1/23–12/31/24.
3 Sources for bullets: WisdomTree, FactSet, for specified periods.
There are risks associated with investing, including the possible loss of principal. Please read the Fund’s prospectus for specific details regarding the Fund’s risk profile.
WTV: Funds focusing their investments on certain sectors increase their vulnerability to any single economic or regulatory development. This may result in greater share price volatility. While the Fund is actively managed, the Fund’s investment process is expected to be heavily dependent on quantitative models and the models may not perform as intended.
QGRW: Growth stocks, as a group, may be out of favor with the market and underperform value stocks or the overall equity market. Growth stocks are generally more sensitive to market movements than other types of stocks. The Fund is non-diversified and, as a result, changes in the market value of a single security could cause greater fluctuations in the value of Fund shares than would occur in a diversified fund. The Fund invests in the securities included in, or representative of, its Index regardless of their investment merit. The Fund does not attempt to outperform its Index or take defensive positions in declining markets and the Index may not perform as intended.

Global Head of Research
Christopher Gannatti began at WisdomTree as a Research Analyst in December 2010, working directly with Jeremy Schwartz, CFA®, Director of Research. In January of 2014, he was promoted to Associate Director of Research where he was responsible to lead different groups of analysts and strategists within the broader Research team at WisdomTree. In February of 2018, Christopher was promoted to Head of Research, Europe, where he was based out of WisdomTree’s London office and was responsible for the full WisdomTree research effort within the European market, as well as supporting the UCITs platform globally. In November 2021, Christopher was promoted to Global Head of Research, now responsible for numerous communications on investment strategy globally, particularly in the thematic equity space. Christopher came to WisdomTree from Lord Abbett, where he worked for four and a half years as a Regional Consultant. He received his MBA in Quantitative Finance, Accounting, and Economics from NYU’s Stern School of Business in 2010, and he received his bachelor’s degree from Colgate University in Economics in 2006. Christopher is a holder of the Chartered Financial Analyst Designation.

