WTV
U.S. Value Fund

Published August 26, 2025

Global Head of Research
When discussions arise about big tech or the Magnificent 7 being in a bubble in 2025, it is essential to ground the conversation in empirical valuation history. The most obvious point of reference remains the dot-com bubble of the late 1990s to early 2000s. At that time, forward price-to-earnings (P/E) ratios for what we would now call the "expanded tech"1 sector of the S&P 500 Index (including companies like Amazon, Tesla and Netflix) peaked in the range of 55 times earnings—levels that were often untethered from fundamentals. Many of those companies lacked positive earnings altogether, meaning the multiple expansion was driven almost entirely by speculation.
Contrast that with today's context: as of August 19, 2025, the S&P 500 North American Expanded Technology Sector Index is trading at 29.7 timesforward earnings, which is well below the tech bubble peak. While elevated relative to its historical median of 22 times, it is not in the same zip code as the late-1990s mania. Importantly, today's valuations are supported by massive revenue bases, proven business models and enormous free cash flow generation. Earnings power is not hypothetical; it is visible in quarterly reports and guidance across the board.
Figure 1: Not All High Multiples Are Bubbles
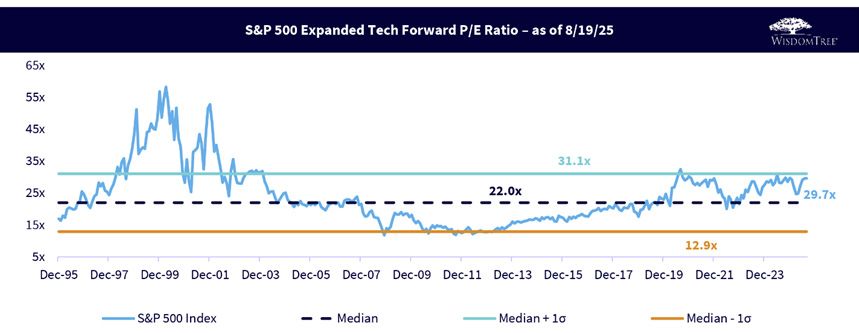
Sources: WisdomTree, FactSet, S&P. You cannot invest directly in an index. Historical forward P/E measured since 12/29/1995. Expanded Tech includes the Information Technology sector, Interactive Home Entertainment subindustry, Interactive Media & Services subindustry, Amazon, E-Bay, Etsy and Netflix. The chart uses the Greek lowercase letter sigma to delineate the measure of standard deviation, which allows us to have a measure of the distribution of the data and how what we see today relates to that. A deviation that is greater than one standard deviation above or below the median might be a more extreme observation.
The median and plus-minus one standard deviation bands tell a deeper story. The current valuation of 29.7 times is almost precisely at one standard deviation above the historical median. In any normal distribution framework, that would be considered elevated, but not extraordinary. In fact, the forward P/E touched and exceeded 30 times on multiple occasions during the 2020–2021 cycle. The fact that we are at 29.7 times today—despite AI enthusiasm, data center buildouts, robotics spending and broad digital transformation—suggests valuations have not run away. If anything, they reflect earnings resilience and a shift in business mix (e.g., cloud, AI inference/training monetization, subscriptions).
Moreover, unlike the 2000 era, today's expanded tech sector includes businesses with significant pricing power, moats from network effects or hardware/software integration, and global market reach. Investors may be paying more for quality and defensiveness, not just speculative upside.
As an example, Alphabet's AI footprint isn't just theoretical, it's operating at global scale, and growing with startling velocity. Google's AI Overviews now serve more than 2 billion monthly active users (MAUs) across 200 countries, while Gemini powers over 450 million monthly users with daily requests growing by more than 50%. Circle to Search has already crossed 300 million Android devices, and Gemini has been adopted by 85,000-plus enterprises, reflecting a 35-times increase in usage yearoveryear. This isn't just a platform shift, it's a commercial machine spinning up in real time. From 70 million videos generated with Veo 3 to 980 trillion tokens processed monthly, the infrastructure is humming. And it's translating to monetization: Demand Gen's AI-driven targeting yields twice the conversion value per dollar spent, while tools like Smart Bidding and AI Max for Search are already pushing conversion rates up 14%–19%.2 For investors watching where AI investment translates into real-world traction, these numbers suggest Alphabet is not just building—it's deploying, scaling and extracting economic value.
Every cycle carries echoes of the past, but it's the differences that offer real insight. Looking at figure 2, in the year 2000,3 the forward P/E ratio for the top 10 technology companies4 stretched into the stratosphere—a staggering 66 times. It was a moment defined less by earnings and more by narrative euphoria: "eyeballs," "new economy" and "disruption" were the currencies of the day. But what followed was painful recalibration. Investors learned that even dreamers need to eventually deliver cash flows. Fast-forward to today, and it's tempting to ask: are we witnessing a repeat performance?
The answer is complex. As of 2025, the forward P/E ratio for the top 10 firms in the S&P Expanded Tech stands at 26.2 times, not cheap, but far from the nosebleed levels of 2000. More importantly, these are no longer speculative plays on the distant future. Today's giants are embedded in the real economy: monetizing AI APIs,5 reshaping cloud infrastructure and absorbing vast swaths of global IT spend. Margins are fat, and moats are wide. Yet with valuations drifting higher over the past 10 years, the market is clearly baking in a level of confidence that leaves little room for execution risk or macroeconomic disappointment.
Figure 2: From Mania to Maturity: Tech's 25-Year Valuation Journey
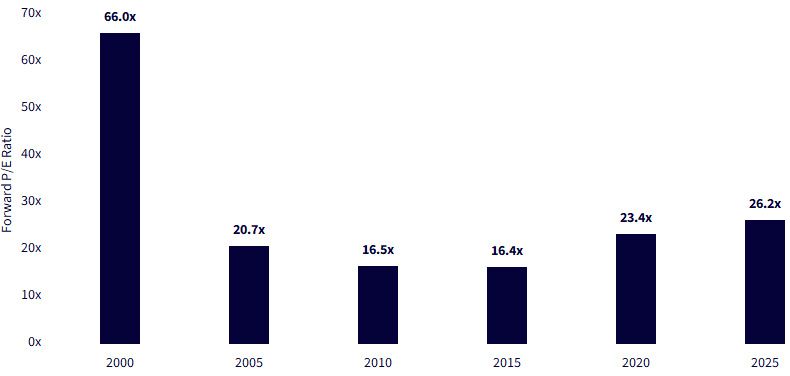
Sources: WisdomTree, FactSet, S&P. You cannot invest directly in an index. Each year represents the weighted average forward P/E ratio of the 10 largest companies by market capitalization within the S&P 500 Expanded Tech Index, with the measurement taken on March 31 of each year. Expanded Tech includes the Information Technology sector, Interactive Home Entertainment subindustry, Interactive Media & Services subindustry, Amazon, E-Bay, Etsy and Netflix.
The conversation around mega-cap tech has evolved dramatically since the dot-com era. In 2000, tech giants commanded high valuations on the promise of future disruption, often with thin or non-existent profit streams. But today's market leaders don't just dominate headlines; they dominate cash flows. The leap in aggregate net income among the top 10 companies in the S&P Expanded Tech tells a story of maturation: these firms have successfully transitioned from high-beta disruptors to foundational pillars of the global economy. They aren't priced purely on potential anymore—they're delivering tangible, robust earnings.
By 2025, aggregate net income has surged past $500 billion, recognizing it was below $100 billion back in 2000. That explosion in profitability isn't coincidental, it's the result of deep moats, massive scale and strategic AI integration. Cloud platforms, productivity suites, chip design, search monetization and generative AI APIs are not just cost centers—they're driving margin expansion. This isn't just tech getting bigger; it's tech getting more economically efficient. And that dynamic can sustain valuation multiples, even as growth rates inevitably slow from their early-phase hyper-growth era.
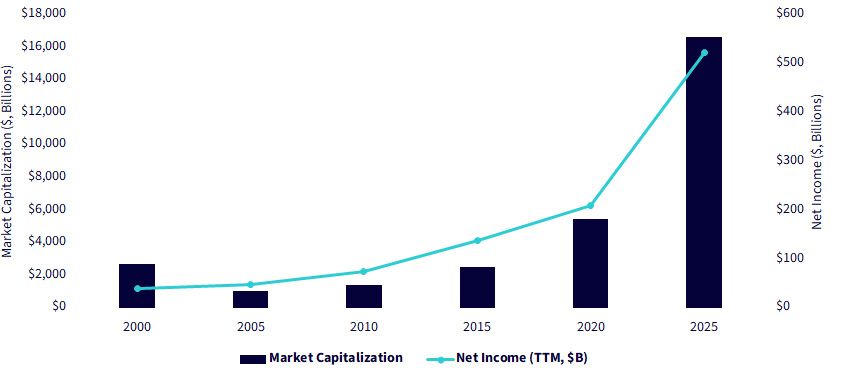
Sources: WisdomTree, FactSet, S&P. You cannot invest directly in an index. Each year represents the market capitalization and the net income of the 10 largest companies by market capitalization within the S&P 500 Expanded Tech Index, with the measurement taken on March 31 of each year. Expanded Tech includes the Information Technology sector, Interactive Home Entertainment subindustry, Interactive Media & Services subindustry, Amazon, E-Bay, Etsy and Netflix.
Perspective from Outside Tech
Figure 4 provides an important sanity check: the forward P/E of the S&P 500 Ex-Information Technology Index is currently at 19.5 times, also above its long-run median of 16.8 times. This implies that even when we remove the mega-cap tech names, the rest of the market is also trading somewhat rich, but still within historical norms. That 19.5 times is close to plus one standard deviation, not beyond it. So, this is not just a tech story—it's a macroeconomic environment that supports higher multiples, perhaps due to structurally lower real rates, a broadening of profitability across sectors or stronger-than-expected gross domestic product (GDP) and productivity growth.
Figure 4: Valuation Expansion without a Bubble
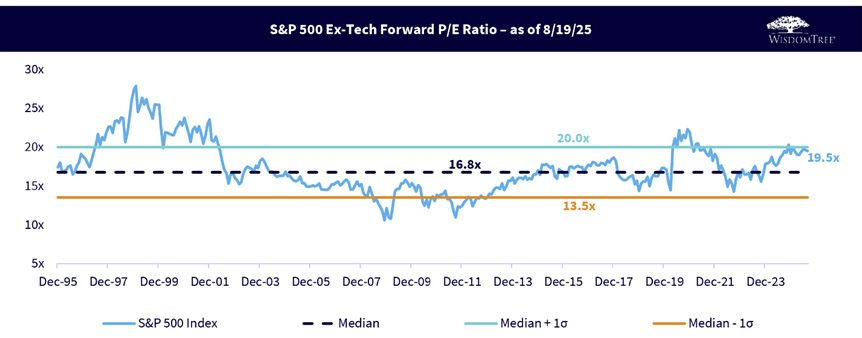
Sources: WisdomTree, FactSet, S&P. You cannot invest directly in an index. Historical forward P/E measured since 12/29/1995. Expanded Tech includes the Information Technology sector, Interactive Home Entertainment subindustry, Interactive Media & Services subindustry, Amazon, E-Bay, Etsy and Netflix. The S&P 500 Ex-Information Technology Index refers to the universe of stocks that is not included in the aforementioned S&P 500 Extended Tech Index. The chart uses the Greek lowercase letter sigma to delineate the measure of standard deviation, which allows us to have a measure of the distribution of the data and how what we see today relates to that. A deviation that is greater than one standard deviation above or below the median might be a more extreme observation.
If U.S. Market Valuation Is a Concern…
With all of this said, we understand that there are those looking at the U.S. market and not liking what they see in terms of valuation. At WisdomTree, we have seen interesting performance in a strategy that focuses on shareholder yield as a means to capture a more value-oriented exposure. We note this strategy in figure 5:
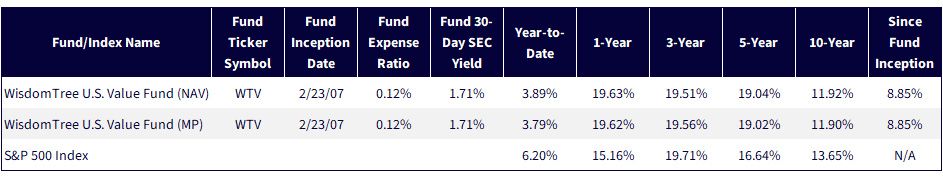
Figure 5b: Shareholder Yield: Value's Quiet Outperformance Story
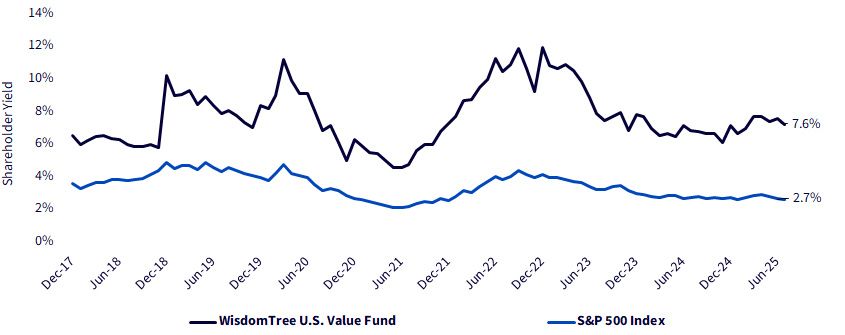
Sources: WisdomTree, FactSet, for the period 12/29/17 to 7/31/25. Period chosen to coincide with the start of the shareholder yield-focused investment process of the WisdomTree U.S. Value Fund (WTV) in December 2017. You cannot invest directly in an index.
To Conclude: Why Now Doesn't Look Like 1999
Several fundamental distinctions set 2025 apart from 1999:
Rather than labeling tech as "overvalued," a more rigorous interpretation might be that tech is relatively expensive for good reasons, but not in a bubble by historical standards. Many investors are paying up for defensible earnings, innovation leverage and exposure to the dominant platform shifts of the next decade (AI, cloud, automation, autonomy). That doesn't mean downside risk is zero—but it does mean the comparison to the dot-com bubble may be intellectually lazy.
1 Expanded Tech is used to recognize that over time certain stocks like Amazon.com and Tesla were included in Consumer Discretionary and certain others like Meta Platforms and Alphabet were included in Communication Services. Including only a strict Information Technology sector would miss certain large technology-oriented companies.
2 Source: B. Nowak et al., "Alphabet Inc. (GOOGL.O): AI Driven Acceleration; Remain OW," Morgan Stanley Research, 7/24/25.
3 Within figure 2, the measurement at five-year increments is made as of March 31 in each year.
4 Refers to the top 10 companies by market capitalization weight within the S&P 500 Expanded Tech Index.
5 Stands for application programming interface.
6 Sources: S. Nadella, in conversation with M. Zuckerberg at Meta LlamaCon: "20–30 percent of the code… in our repos today is probably all AI-written," (Microsoft CEO remarks on AI-generated code contribution), TechCrunch, April 2025; M. Zuckerberg, "Meta expects half of Llama development to be done by AI within a year," (statement at LlamaCon), TechBooky, The Register, 4/29/25; S. Pichai, "Over 30% of new code at Google is generated by AI," (Q1 2025 earnings call statement), Moneycontrol (reporting), 4/24/25.
7 Source: "iShares Global ETF Flows Dashboard: May 2025," BlackRock, May 2025.
There are risks associated with investing, including the possible loss of principal. Funds focusing their investments on certain sectors increase their vulnerability to any single economic or regulatory development. This may result in greater share price volatility. While the Fund is actively managed, the Fund’s investment process is expected to be heavily dependent on quantitative models, and the models may not perform as intended. Please read the Fund’s prospectus for specific details regarding the Fund’s risk profile.
U.S. Value Fund

Global Head of Research
Christopher Gannatti began at WisdomTree as a Research Analyst in December 2010, working directly with Jeremy Schwartz, CFA®, Director of Research. In January of 2014, he was promoted to Associate Director of Research where he was responsible to lead different groups of analysts and strategists within the broader Research team at WisdomTree. In February of 2018, Christopher was promoted to Head of Research, Europe, where he was based out of WisdomTree’s London office and was responsible for the full WisdomTree research effort within the European market, as well as supporting the UCITs platform globally. In November 2021, Christopher was promoted to Global Head of Research, now responsible for numerous communications on investment strategy globally, particularly in the thematic equity space. Christopher came to WisdomTree from Lord Abbett, where he worked for four and a half years as a Regional Consultant. He received his MBA in Quantitative Finance, Accounting, and Economics from NYU’s Stern School of Business in 2010, and he received his bachelor’s degree from Colgate University in Economics in 2006. Christopher is a holder of the Chartered Financial Analyst Designation.


