
DGRW
U.S. Quality Dividend Growth Fund

Published August 5, 2025

Global Head of Research
Dividend growth has long appealed to investors seeking a middle path—one that balances the potential for capital appreciation with the tangible comfort of a recurring cash flow. Yet beneath that broad umbrella lies a range of philosophies. Some index strategies demand ironclad consistency: 10, 20 or 25 consecutive years of dividend growth, for example.1 Others take a more permissive stance, welcoming newer dividend growers with open arms if certain quality filters are met. The resulting portfolios may look dramatically different, even when they all claim the same objective—investing in "dividend growers."
Where Were You 25 Years Ago?
That's not just a question for nostalgia—it's the implicit challenge posed by the S&P 500 Dividend Aristocrats Index.2 The S&P High Yield Dividend Aristocrats Index could adjust the question to 20 years.3 To make the cut, a company needed to have started increasing its dividend every single year back when Y2K4 anxiety was peaking and dial-up internet was still a thing. These indexes sit firmly at the conservative end of the dividend strategy spectrum, favoring firms that have weathered recessions, tech booms, financial crises and everything in between. That kind of consistency offers a certain psychological comfort—it says, "We've been here before, and we'll be here after the next downturn too." But the flip side? It screens out the new guard. The disruptors. The companies that didn't exist—or didn't yet pay a dividend—when Alan Greenspan was still Fed Chair.5 In doing so, these strategies anchor themselves to historical durability, often at the cost of capturing forward-looking growth. In a world being rewritten by artificial intelligence (AI), semiconductors and cloud-native margins,6 that trade-off is worth examining.
How about 10 Years?
Riding down the spectrum a bit lies the S&P U.S. Dividend Growers Index, which only requires 10 years of growth and actively excludes the highest-yielding quartile of stocks.7 The rationale is intuitive: extremely high yields may reflect distressed fundamentals or unsustainable payout ratios—a "yield trap" that undermines the core objective of dividend growth. This design opens the door to a more growth-tilted portfolio, incorporating companies that may still be evolving but exhibit positive trends in profitability and capital allocation.
The Dow Jones U.S. Select Dividend Index takes yet another route: while it requires only a five-year dividend history, it layers on payout ratio constraints and weighting based on its indicated annual dividend,8 delivering higher income but with a different type of risk—more value exposure and sector concentration.
How about Adding Significant Dividend-Payers when They Initiate Dividend Policies?
That brings us to the WisdomTree U.S. Quality Dividend Growth Index, the foundation for the WisdomTree U.S. Quality Dividend Growth Fund (DGRW). It takes a more pragmatic—and more forward-looking—approach. There's no need for a 5-, 10-, 20- or 25-year dividend growth or payment résumé. The only requirement is that a company pays a regular dividend today. But don't mistake that openness for looseness. Entry is filtered through a deliberate framework: earnings yield must exceed dividend yield, and candidates are ranked on return on equity, return on assets and estimated forward earnings growth. The logic is clear—future dividend growth flows from future earnings power, and capital-efficient companies with runway should be recognized sooner, not later. And here's where WisdomTree adds a unique wrinkle: the Index doesn't wait around for a calendar-year rebalance. If a company like Meta Platforms or Alphabet initiates a dividend and meets the quality screens, it can be added quickly—reflecting not just a rules-based discipline, but a responsiveness to what's actually happening in the market.9 It's not about rewarding corporate nostalgia. It's about capturing dividend growth the moment it becomes real.
For investors seeking to translate index philosophy into portfolio exposure, there are several ETF options. These represent an array of some of the largest ETFs with underlying index methodologies that touch dividend growth in the manner we have mentioned.
In what follows, we will line up these strategies against the S&P 500 Index.
Figure 1: Standardized Performance
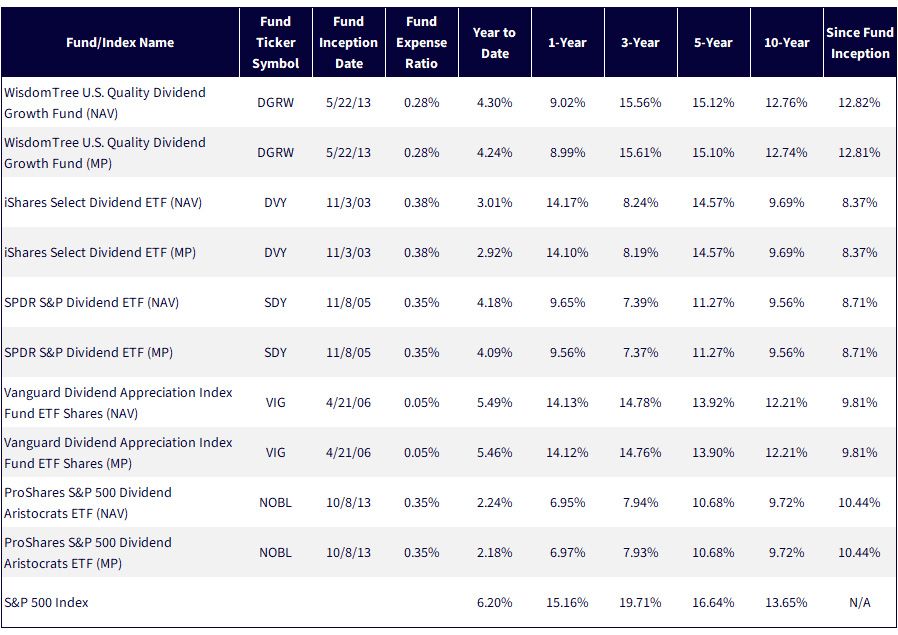
Sources: WisdomTree, FactSet, specifically data from the Fund Comparison Tool in the PATH suite of tools, accessed 7/18/25, with returns as of 6/30/25. NAV denotes total return performance at net asset value. MP denotes market price performance. The performance data quoted represents past performance and is not indicative of future results. Investment return and principal value of an investment will fluctuate so that an investor's shares, when redeemed, may be worth more or less than their original cost. Current performance may be lower or higher than the performance data quoted. For the most recent month-end and standardized performance, click the relevant ticker: DGRW, DVY, SDY, VIG, NOBL.
What makes figure 2 so compelling is not just the color contrast—but the temporal signal embedded in it. The S&P 500 Index, glowing in dark green across nearly every column, has been dominant (the deeper the shade of green, the stronger the relative performance within the figure). That dominance—especially in the three-year and year-to-date windows—has created a tough backdrop for dividend-focused strategies.
But step back, and something deeper emerges. While the short-term performance heavily favors growth and mega-cap concentration, the longer-term figures (10-year and longest common period10) reveal a narrowing gap. Dividend strategies like DGRW and VIG close in significantly, suggesting that when cycles run full course—through rate hikes, earnings resets and market rotations—quality dividend growers reassert their role.
That shift is critical. It tells us these strategies aren't broken; they're out of phase with the current environment. When capital chases innovation-at-any-price or rewards a handful of ultra-scalers, the S&P 500 takes on a personality that isn't reflective of the average stock. But when the market broadens, or when earnings durability and capital return regain importance, dividend growth re-enters the conversation with force. DGRW's 10-year return of 12.7% versus the S&P 500's 13.5% is a rounding error in relative terms, especially given the risk characteristics and yield kicker DGRW offers.
Figure 2: Anyone Can Win a Quarter. Few Can Win a Decade.
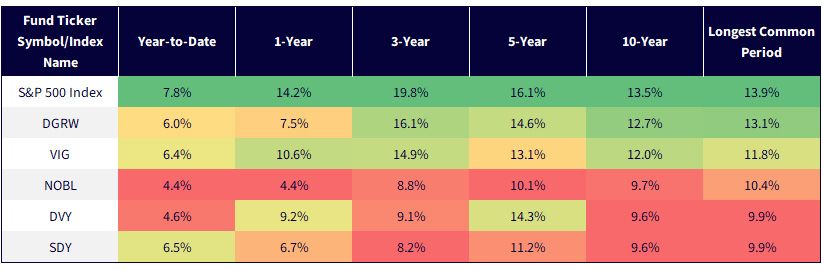
Sources: WisdomTree, FactSet, specifically data from the Fund Comparison Tool in the PATH suite of tools, accessed 7/18/25, with returns as of 7/17/25. NAV denotes total return performance at net asset value. "Common period" denotes the specific historical timeframe during which all the ETFs or indexes being analyzed existed and have available pricing data. Past performance is not indicative of future results. Investment return and principal value of an investment will fluctuate so that an investor's shares, when redeemed, may be worth more or less than their original cost. Current performance may be lower or higher than the performance data quoted. For the most recent month-end and standardized performance, click the relevant ticker: DGRW, DVY, SDY, VIG, NOBL.
If you're trying to understand why some dividend growth strategies have lagged the S&P 500 recently, the top 10 holdings provide a visual X-ray in figure 3. The S&P 500 is concentrated in the so-called Magnificent 7—NVIDIA, Microsoft, Apple, Amazon, Alphabet, Meta and Tesla. Together, they drive not only the index's direction, but also the narrative. So, any strategy lacking meaningful exposure to that cohort risks being out of phase when those names dominate returns.
While DGRW is certainly not hugging the S&P 500, it's not structurally excluded from its gains either. Microsoft, Apple, NVIDIA, Alphabet—these are all present in the top 10, helping DGRW capture part of the upside when mega-cap tech leads the market. And it does this without abandoning its quality and dividend-growth framework. In effect, DGRW has built a bridge between high-conviction dividend investing and the reality of modern index dynamics.
Contrast that with DVY and SDY—whose top holdings like Altria, Ford and KeyCorp reflect a different philosophy altogether: mature, high-yielding, value-oriented sectors that offer stability but little connection to today's growth engine. They aren't broken; they're just fundamentally aligned with different economic sensitivities—ones that don't tend to outperform when semiconductors, AI and cloud platforms are driving index returns.
VIG threads the needle more subtly, including names like Microsoft and Apple, but weighting them conservatively and screening out the highest yielders—trading speed of inclusion for slow, steady compounding. NOBL, with its 25-year growth requirement, structurally excludes most of the Mag 7 and leans into resilience over momentum. The takeaway isn't that one strategy is superior; it's that each aligns—or misaligns—with market leadership in different ways. When the S&P 500 runs hot on tech narratives and multiple expansion, DGRW and VIG are better positioned to stay within the slipstream, while DVY, SDY and NOBL lag more noticeably. In that context, DGRW stands out not by chasing what's working, but by being designed to never stray too far from it—offering dividend discipline and directional relevance in a single package.
Figure 3: NVIDIA or KeyCorp in July 2025?
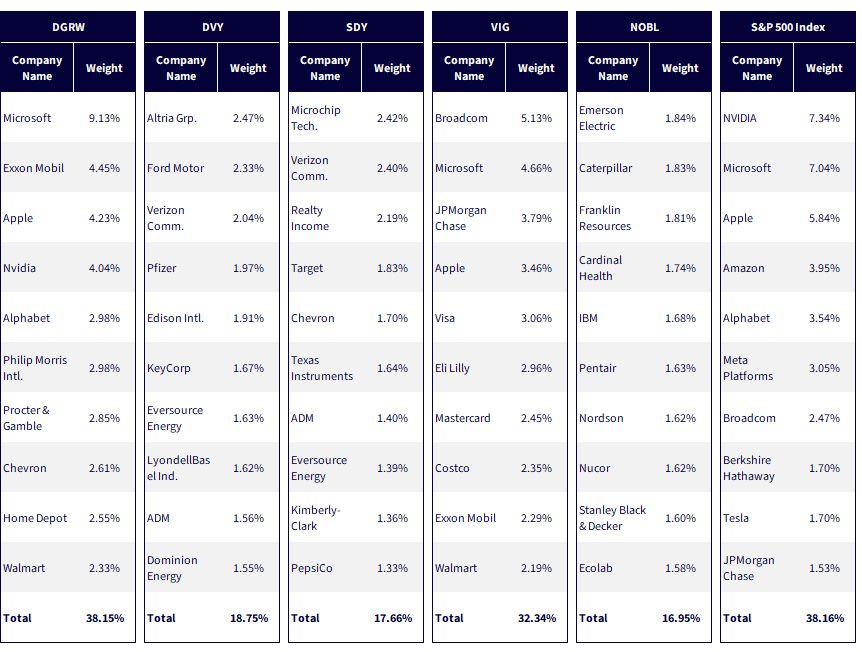
Sources: WisdomTree, Morningstar and FactSet, with data as of 6/30/25. Holdings subject to change.
Sectors are the scaffolding of equity portfolios, and in July 2025 within figure 4, they help explain why some dividend strategies have kept pace with the S&P 500 while others have lagged. The index's leadership is still centered in Information Technology, Communication Services, and Consumer Discretionary—home to the Magnificent 7 and the engine of recent returns. DGRW stands out for staying aligned with that leadership: its exposure to Microsoft, Apple, Nvidia and Alphabet reflects a methodology that doesn't fight the market's structure. In contrast, DVY and SDY remain anchored in Financials, Utilities and Energy—sectors out of phase with today's growth cycle. VIG takes a more balanced posture, while NOBL, due to its 25-year dividend screen, naturally skews toward Industrials and Staples. The takeaway is clear: in a narrow market, sector alignment is not just a detail—it's destiny. And among dividend strategies, those that look forward—not backward—may be better positioned for what comes next.
Figure 4: Tech, AI and the Missing Weight: The Sector Gap That Drives Performance
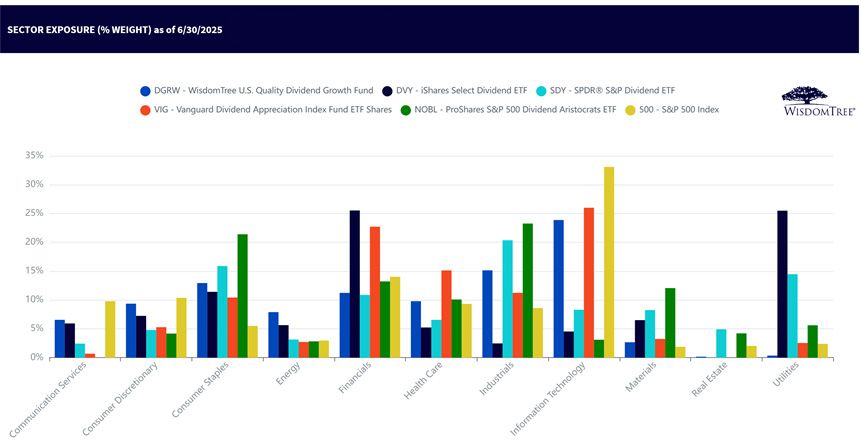
Sources: WisdomTree, Morningstar and FactSet, with data as of 6/30/25. Holdings subject to change.
Why Staying the Course Is Sometimes the Edge
Every investor eventually faces the same temptation: to chase what's working now. When the S&P 500 is printing new highs, powered by the relentless march of mega-cap growth and AI-fueled optimism, it's natural to question whether a dividend strategy—especially one that's lagging in the moment—is still relevant. But history teaches us that what's in phase today can just as quickly fall out of sync tomorrow. The real challenge isn't picking the best strategy for the last 12 months—it's finding one that can persist through market cycles, not just market moods.
That's where methodology matters. Dividend strategies vary not only by sector and style, but by philosophy. Some place their trust in long-established records—decades of dividend increases, a time-tested proxy for quality and discipline. Others, like DGRW, chart a different course: instead of waiting 20 years to recognize a company's potential, they ask a more forward-looking question—does this business have the balance sheet, earnings power and capital efficiency to grow dividends from here?
Right now, DGRW may be out of phase relative to the S&P 500 Index. It's not overweight NVIDIA or Amazon to the same degree, and it's not built to track the sharpest turns of market momentum. But in the universe of dividend strategies, DGRW continues to distinguish itself. It maintains exposure to key growth sectors, while staying disciplined in its quality and payout screens. It hasn't abandoned its process to catch a trade. And that consistency is its strength.
Figure 5: Additional Information
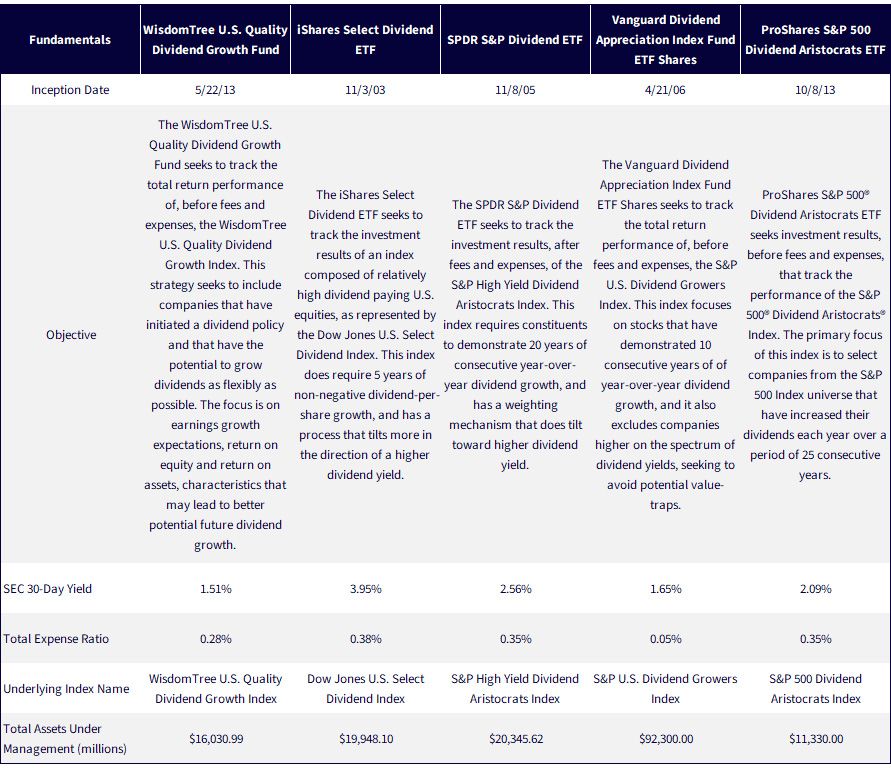
Sources: WisdomTree, iShares, SPDR, Vanguard and ProShares, as of 6/30/25, except for assets under management, which is as of 7/17/25. The investment objectives, strategies, policies or restrictions of other funds may differ and more information can be found in their respective prospectuses. Therefore, we generally do not believe it is possible to make direct fund to fund comparisons in an effort to highlight the benefits of a fund versus another similarly managed fund.
1 References the S&P U.S. Dividend Growers Index, the S&P High Yield Dividend Aristocrats Index and the S&P 500 Dividend Aristocrats Index, which require 10, 20 and 25 consecutive years of dividend growth among their constituents, respectively.
2 Source: S&P Dow Jones Indices, S&P Dividend Aristocrats Indices Methodology, S&P Global, January 2024.
3 Source: S&P Dow Jones Indices, S&P Dividend Aristocrats Indices Methodology, S&P Global, January 2024.
4 Refers to concerns as to what might happen when computers rolled from December 31, 1999, to January 1, 2000, since it was possible with only two digits for the year, that 00 might be mistaken for 1900.
5 Source: Board of Governors of the Federal Reserve System, Alan Greenspan. "Cloud native" refers to a software development and deployment approach that leverages the characteristics of cloud computing to build and run applications
6 Companies that run software-as-a-service in the cloud tend to have very high profitability, but also to have not yet been around for 20 or 25 years.
7 Source: S&P Dow Jones Indices, S&P Dividend Growers Index Series Methodology, S&P Global, March 2024.
8 Source: S&P Dow Jones Indices, Dow Jones U.S. Select Dividend Index Methodology, S&P Global, December 2023.
9 Source: WisdomTree U.S. Quality Dividend Growth Index Methodology Guide, WisdomTree Investments, Inc., 3/31/24.
10 Longest common period refers to the period since NOBL's inception, which began trading on 10/8/13.
DGRW: There are risks associated with investing, including the possible loss of principal. Funds focusing their investments on certain sectors increase their vulnerability to any single economic or regulatory development. This may result in greater share price volatility. Dividends are not guaranteed, and a company currently paying dividends may cease paying dividends at any time. Please read the Fund’s prospectus for specific details regarding the Fund’s risk profile.
DVY: Carefully consider the fund’s investment objectives, risk factors, and charges and expenses before investing. This and other information can be found in the fund’s prospectus, and if available, summary prospectus, which may be obtained by calling 1-800-iShares (1-800-474-2737) or by visiting www.iShares.com or www.blackrock.com. Read the prospectus carefully before investing.
Investing involves risk, including the possible loss of principal.
There is no guarantee that dividends will be paid.
Diversification may not protect against market risk or loss of principal. Shares of ETFs are bought and sold at market price (not NAV) and are not individually redeemed from the fund. Any applicable brokerage commissions will reduce returns.
SDY: Before investing, consider the funds’ investment objectives, risks, charges and expenses. To obtain a prospectus or summary prospectus which contains this and other information, call 1-866-787-2257 or visit www.statestreet.com/im. Read it carefully.
VIG: All investing is subject to risk, including the possible loss of the money you invest. Funds that concentrate on a relatively narrow market sector face the risk of higher share-price volatility. Investments in stocks or bonds issued by non-U.S. companies are subject to risks including country/regional risk and currency risk.
NOBL: Carefully consider the investment objectives, risks, charges and expenses of ProShares before investing. This material must be preceded or accompanied by the current fund prospectus. Read it carefully before investing.
Investing involves risk, including the possible loss of principal. This ProShares ETF is subject certain risks, including imperfect benchmark correlation and market price variance. that may decrease performance. Please see the summary and full prospectuses for a more complete description of risks. There is no guarantee any ProShares ETF will achieve its investment objective.
Shares of any ETF are generally bought and sold at market price (not NAV) and are not individually redeemed from the fund. Brokerage commissions will reduce returns. ProShares are distributed by SEI Investments Distribution Co., which is not affiliated with the fund’s advisor.
U.S. Quality Dividend Growth Fund

Global Head of Research
Christopher Gannatti began at WisdomTree as a Research Analyst in December 2010, working directly with Jeremy Schwartz, CFA®, Director of Research. In January of 2014, he was promoted to Associate Director of Research where he was responsible to lead different groups of analysts and strategists within the broader Research team at WisdomTree. In February of 2018, Christopher was promoted to Head of Research, Europe, where he was based out of WisdomTree’s London office and was responsible for the full WisdomTree research effort within the European market, as well as supporting the UCITs platform globally. In November 2021, Christopher was promoted to Global Head of Research, now responsible for numerous communications on investment strategy globally, particularly in the thematic equity space. Christopher came to WisdomTree from Lord Abbett, where he worked for four and a half years as a Regional Consultant. He received his MBA in Quantitative Finance, Accounting, and Economics from NYU’s Stern School of Business in 2010, and he received his bachelor’s degree from Colgate University in Economics in 2006. Christopher is a holder of the Chartered Financial Analyst Designation.

