GDMN
Efficient Gold Plus Gold Miners Strategy Fund

Published July 8, 2025

Global Head of Research
After years of quiet accumulation, 2025 has been the year gold stepped loudly back into the financial conversation. The metal has not only broken through its historical highs but has sustained levels above $3,000 per troy ounce—a psychological and strategic milestone.1 While equities have chopped sideways and macroeconomic crosscurrents have intensified, gold has delivered clarity in the form of performance.
But that clarity is now giving way to harder questions. For those who already hold gold, the recent run has been a validation. For those still on the sidelines, it may feel like they missed it. Yet the forward-looking investor should be less concerned with price history and more attuned to structural drivers. Gold's resurgence is not just about war, inflation or monetary hedging in isolation—it's about confidence. Confidence in institutions, in fiat, in the sustainability of fiscal trajectories. In 2025, that confidence is showing cracks.
This does not guarantee that gold's price will continue to surge. In fact, the case may evolve—from price appreciation to strategic role-playing. Gold as ballast. Gold as correlation disruptor. Gold as optionality in a regime where policy tools are exhausted and volatility proves to be structural rather than transitory. The return profile going forward may be less about beta and more about convexity2 in a stressed system.
And if that's the case, it opens up new questions: what is the optimal way to express that exposure? Is it physical, futures-based, miner equities, royalty and streaming models, or something more novel—like tokenized gold or gold-integrated multi-asset strategies? In 2025, gold is back in the portfolio construction conversation. But the debate is shifting from "why gold" to "which gold—and how."
So, let's consider some of the more popular choices facing investors:
Or, there is a third option that has entered the arena—capital-efficient exposures that combine gold and gold miners into a single vehicle, such as the WisdomTree Efficient Gold Plus Gold Miners Strategy Fund (GDMN).5 This Fund aims to deliver both the stability of the metal and the growth potential of the miners, while preserving portfolio capital to be deployed elsewhere.
Considering the First Half of 2025—Quite a Wild Ride to a Roughly Flat Return
As of June 30, 2025, the S&P 500 Index was up 6.2%, and we can note that the experience to get there included a positive start to the year, a drawdown and then a recovery. However, while this was happening, GLD appreciated 25.7%, GDX appreciated 53.6% and GDMN appreciated 75.2%.6
These different gold-sensitive exposures may be attracting different degrees of interest because of this contrast in returns relative to the S&P 500 benchmark.
Figures 1a and 1b look at returns over different periods. The longest available period goes back to the inception of GDMN, December 16, 2021. Many may be surprised by the fact that GLD outperformed the S&P 500 (18.7% per year vs. 9.7% per year) from December 16, 2021, to June 30, 2025. We'd remind people that 2022 was characterized largely by "inflation-fighting" and was a very difficult year for traditional asset classes.
It's interesting that over this period from December 16, 2021, to June 30, 2025, GDX's return was only slightly more than that of GLD. Over this particular period, GLD appreciated, but GDX did not offer much of an incremental improvement, the result of being exposed to the businesses of the miners.
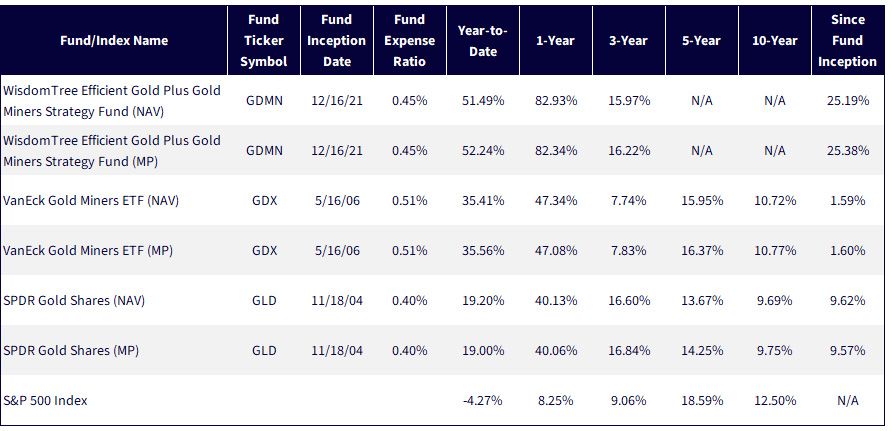
Sources: Morningstar, FactSet and WisdomTree, specifically data from the PATH Fund Comparison Tool, accessed as of 6/6/25, showing returns for the period ended 3/31/25. NAV denotes total return performance at net asset value. MP denotes market price performance. Past performance is not indicative of future results. Investment return and principal value of an investment will fluctuate so that an investor's shares, when redeemed, may be worth more or less than their original cost. Current performance may be lower or higher than the performance data quoted. For the most recent month-end and standardized performance, click the respective ticker: GDMN, GDX, GLD.
Figure 1b: Gold-Sensitive Exposures Have Delivered Strong Returns of Late
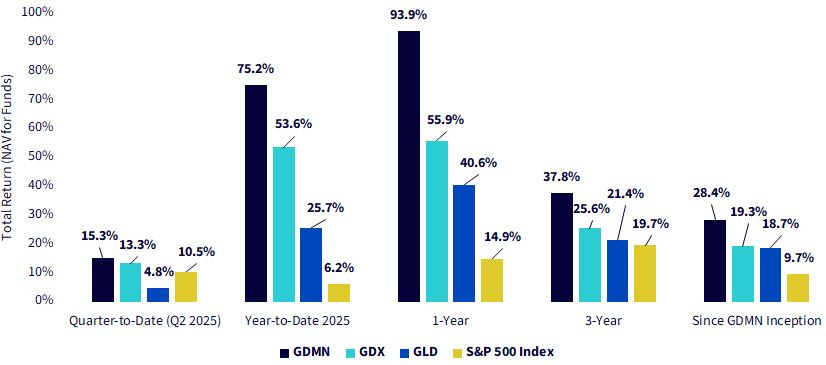
Sources: Morningstar, FactSet and WisdomTree, specifically data from the PATH Fund Comparison Tool, accessed as of 7/1/25, showing returns for the period ended 6/30/25. NAV denotes total return performance at net asset value. MP denotes market price performance. Since GDMN Inception begins 12/16/21. Past performance is not indicative of future results. Investment return and principal value of an investment will fluctuate so that an investor's shares, when redeemed, may be worth more or less than their original cost. Current performance may be lower or higher than the performance data quoted. For the most recent month-end and standardized performance, click the respective ticker: GDMN, GDX, GLD.
Gold-Sensitive Strategies Are Anchored to Gold
As investors consider GDMN, GDX and GLD inside of the investment toolkit, a logical starting point is the price of gold. Looking at GLD:
We can therefore go back over a number of years and use GLD's return to define years in this way:
1. Certain years were characterized by GLD delivering a negative return, therefore a tougher period for gold.
2. Certain years were characterized by GLD delivering a positive return, therefore a stronger period for gold.
We already noted that many look at gold-mining equities as a way to create a more sensitive exposure to the price of gold, meaning a beta of greater than 1.0 relative to the price of gold can be expected.7 If gold's price is positive, this could mean outperforming, but similarly if gold's price is negative, this could mean underperforming and losing more in these environments.
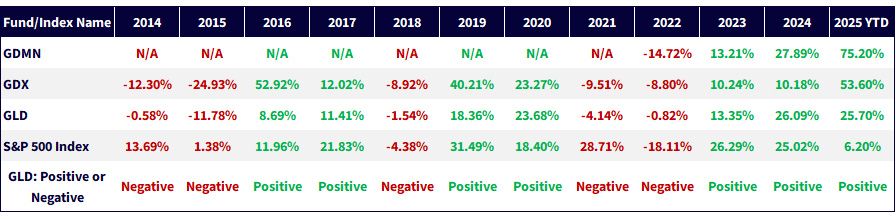
Figures 2a and 2b go back to 2014, grouping years where GLD delivered a negative return (there were five) and years where GLD delivered a positive return (there were six).
GDMN was included in figure 2a, but we could not include it in the averages because it only began live calculation on December 16, 2021.
It's important to add in the 2025 year-to-date period. While we don't know what the rest of the year may hold, when you see gold up 25.7% after six months—and this coming after a 2024 full-year return of slightly better than 26%—it's clear we have experienced sustained gold price appreciation. Looking to GDX, it's notable that 2023 and 2024 were positive, but just above 10%. Now, year-to-date 2025, we are looking at a 53.6% return. We don't know if gold miners will hold onto these gains as 2025 continues to unfold, but gold miners cannot shift their strategy based on short-term moves in the gold price. Now that we have 2023, 2024 and six months of 2025 where gold's price has appreciated, there is a logic to seeing gold miners making more positive moves.
Figure 2a: Calendar Year Returns and whether GLD Was Positive or Negative
Sources: Morningstar, FactSet and WisdomTree, specifically data from the PATH Fund Comparison Tool, accessed as of 7/1/25, showing returns for the period ended 6/30/25 for the 2025 YTD period. NAV denotes total return performance at net asset value. MP denotes market price performance. Past performance is not indicative of future results. Investment return and principal value of an investment will fluctuate so that an investor's shares, when redeemed, may be worth more or less than their original cost. Current performance may be lower or higher than the performance data quoted. For the most recent month-end and standardized performance, click the respective ticker: GDMN, GDX, GLD.
Figure 2b: Average Calendar Year Returns when GLD's Return Was Positive or Negative
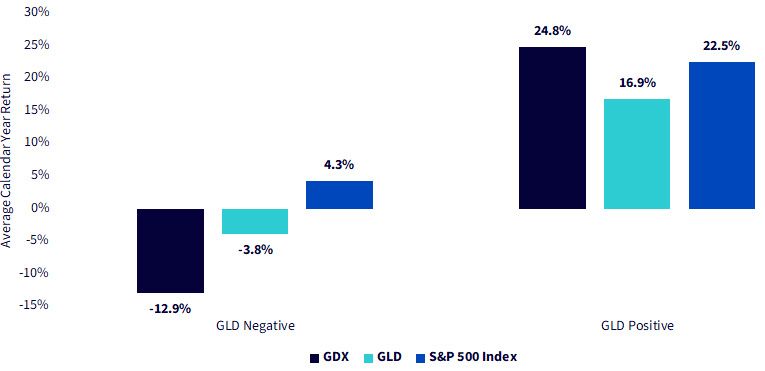
Sources: Morningstar, FactSet and WisdomTree, specifically data from the PATH Fund Comparison Tool, accessed as of 6/6/25, showing returns for the period ended 12/31/24, the most recent full year. NAV denotes total return performance at net asset value. MP denotes market price performance. Past performance is not indicative of future results. Investment return and principal value of an investment will fluctuate so that an investor's shares, when redeemed, may be worth more or less than their original cost. Current performance may be lower or higher than the performance data quoted. For the most recent month-end and standardized performance, click the respective ticker: GDMN, GDX, GLD.
Greatland Gold redefined junior mining by acquiring Telfer and Havieron from Newmont, generating $253 million in free cash flow and building a $398 million cash pile.8 Coeur Mining echoed this strategy, acquiring SilverCrest for $1.7 billion and scaling low-cost output. Both show how smart M&A turns gold prices into sustained margin leverage.9
Think gold mining is still just shovels, shafts and sulfur? Not at Northern Star Resources. They're embedding AI and automation into the heart of operations, aiming to reduce costs and improve safety in a business where marginal gains move mountains. Their CEO calls it "a fantastic time to be in gold"—but it's clear they're making their own luck with innovation as their pickaxe.10
Even Barrick Gold, a stalwart, is surprising us. Production dropped nearly 20% year over year in Q1 2025—but earnings per share (EPS) soared 84%.11 How? High-margin mines and obsessive attention to cost discipline. In a way, Barrick is a story of subtraction as strategy: doing less, but making more from what it does.
Agnico Eagle delivered record production, free cash flow and margins—while keeping 2025 cost inflation under 4% and cash costs at $940 per ounce.12 Newmont showed the power of diversification: alongside gold, its silver, copper, lead and zinc output drove a 127% EPS surge and 25% revenue growth amid market volatility.13
Wheaton Precious Metals streams,14 rather than mines—financing operations in exchange for discounted output. In 2025, 83% of production comes from the lowest-cost mines, driving record Q1 revenue ($470 million), earnings ($254 million) and cash flow ($361 million). With 40% growth forecast and 46 assets globally, Wheaton combines capital efficiency with sustained margin leverage.15
Conclusion: Why Are You Looking at Gold?
When investors turn to gold, what are they truly seeking? Is it a hedge against inflation, a store of value in times of uncertainty, a non-correlated asset for diversification or a tactical trade on macro dynamics? The answer differs depending on the investor—and increasingly, so do the options available to express that view.
Gold bullion, gold-mining equities and capital-efficient gold strategies each offer distinct exposures, return profiles and risk characteristics. Some deliver purer alignment with the spot price of gold. Others introduce operational leverage, equity market sensitivity or sophisticated overlays designed to improve capital efficiency.
As forward-looking returns remain unknowable, the core challenge becomes not predicting gold's next move, but selecting the right vehicle that best maps to the investor's objective. In the age of proliferation and portfolio customization, gold-sensitive investing is no longer a binary decision. It's a design problem. There is no universal answer—only better alignment between tools and goals.
Figure 3: Other Information
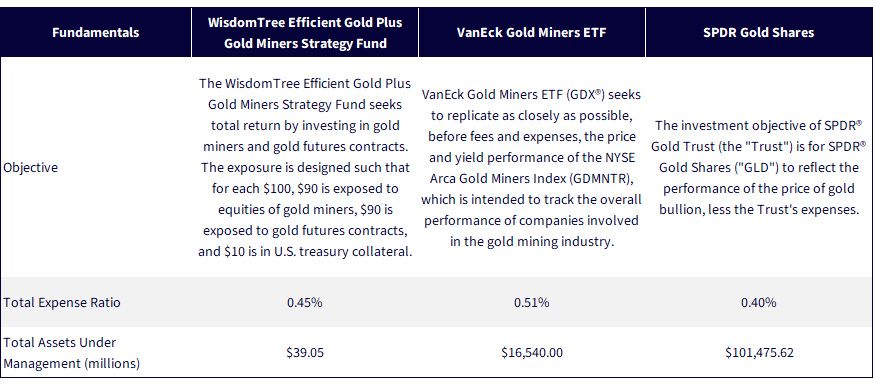
Sources: WisdomTree, VanEck and SPDR. Assets under management as of 6/5/25.
1 Source: "Gold Rises as Weak U.S. Data Offsets Optimism from Trump-Xi Call," Reuters, 6/6/25.
2 Convexity in gold's return profile means its price responds non-linearly—often accelerating disproportionately—when macroeconomic stress or monetary instability cross critical thresholds.
3 The investment objective of SPDR® Gold Trust (the "Trust") is for SPDR® Gold Shares ("GLD") to reflect the performance of the price of gold bullion, less the Trust's expenses. It is the largest fund ranked by assets under management that provides exposure to movements in the price of physical gold.
4 VanEck Gold Miners ETF (GDX®) seeks to replicate as closely as possible, before fees and expenses, the price and yield performance of the NYSE Arca Gold Miners Index (GDMNTR), which is intended to track the overall performance of companies involved in the gold mining industry. It is the largest fund ranked by assets under management that provides exposure to movements in the share prices of a group of gold mining companies.
5 The WisdomTree Efficient Gold Plus Gold Miners Strategy Fund seeks total return by investing in gold miners and gold futures contracts. The exposure is designed such that for each $100, $90 is exposed to equities of gold miners, $90 is exposed to gold futures contracts and $10 is in U.S. treasury collateral.
6 Shown in figure 1b as the Year-to-Date 2025.
7 A beta of greater than 1.0 implies moves of larger magnitude relative to a benchmark, such as if a benchmark was up (or down) 1.0%, then an asset with a beta of greater than 1.0 would tend to move up (or down) by more than 1.0%.
8 Source: "March 2025 Quarterly Activities Report," Greatland Gold PLC, 4/14/25. Retrieved from https://www.share-talk.com/greatland-gold-plc-aimggp-march-2025-quarterly-activities-report/
9 Source: "Coeur Announces Acquisition of SilverCrest to Create Leading Global Silver Company," Coeur Mining, Inc., 10/4/24. Retrieved from https://www.coeur.com/investors/news/news-details/2024/Coeur-Announces-Acquisition-of-SilverCrest-to-Create-Leading-Global-Silver-Company/default.aspx
10 Source: S. Tonkin, "Fantastic Time to Be in Gold: Northern Star CEO," The Australian, 12/31/24. Retrieved from https://www.theaustralian.com.au/business/companies/northern-star-ceo-stuart-tonkin-a-fantastic-time-to-be-in-gold/news-story/b5db8f80a1f9aee364984b607ae159af
11 Source: "Barrick Reports Solid Q1 Results and Progress on Strategic Growth Objectives," Barrick Mining Corporation, 5/7/25. Retrieved from https://www.barrick.com/English/news/news-details/2025/q1-2025-results/default.aspxinvesting.com+9
12 Source: "Agnico Eagle Reports First Quarter 2025 Results – Strong Quarterly Operational and Financial Performance; Balance Sheet further Strengthened by Strong Free Cash Flow Generation; 16th Annual Sustainability Report Released," Agnico Eagle Mines Limited, 4/24/25.
13 Source: "Newmont Reports First Quarter 2025 Results," Newmont Corporation, 4/23/25. Retrieved from https://www.newmont.com/investors/news-release/news-details/2025/Newmont-Reports-First-Quarter-2025-Results/default.aspx
14 Streaming is a financing model where investors provide upfront capital to miners in exchange for rights to purchase future metal production at fixed, discounted prices—without owning or operating mines.
15 Source: "Wheaton Precious Metals Announces Record Revenue, Adjusted Net Earnings and Operating Cash Flow for the First Quarter of 2025," Wheaton Precious Metals Corp., 5/8/25.
There are risks associated with investing, including the possible loss of principal. The Fund is actively managed and invests in U.S.-listed gold futures and global equity securities issued by companies that derive at least 50% of their revenue from the gold mining business (“Gold Miners”). The Fund’s use of U.S.-listed gold futures contracts will give rise to leverage, magnifying gains and losses and causing the Fund to be more volatile than if it had not been leveraged. Moreover, the price movements in gold and gold futures contracts may fluctuate quickly and dramatically, and have a historically low correlation with the returns of the stock and bond markets. By investing in the equity securities of Gold Miners, the Fund may be susceptible to financial, economic, political or market events that impact the gold mining sub-industry, including commodity prices and the success of exploration projects. The Fund may invest a significant portion of its assets in the securities of companies of a single country or region, including emerging markets, and thus, the Fund is more likely to be impacted by events and political, economic or regulatory conditions affecting that country or region, or emerging markets generally. The Fund’s investment strategy will also require it to redeem shares for cash or to otherwise include cash as part of its redemption proceeds, which may cause the Fund to recognize capital gains. Please read the Fund’s prospectus for specific details regarding the Fund’s risk profile.
Efficient Gold Plus Gold Miners Strategy Fund

Global Head of Research
Christopher Gannatti began at WisdomTree as a Research Analyst in December 2010, working directly with Jeremy Schwartz, CFA®, Director of Research. In January of 2014, he was promoted to Associate Director of Research where he was responsible to lead different groups of analysts and strategists within the broader Research team at WisdomTree. In February of 2018, Christopher was promoted to Head of Research, Europe, where he was based out of WisdomTree’s London office and was responsible for the full WisdomTree research effort within the European market, as well as supporting the UCITs platform globally. In November 2021, Christopher was promoted to Global Head of Research, now responsible for numerous communications on investment strategy globally, particularly in the thematic equity space. Christopher came to WisdomTree from Lord Abbett, where he worked for four and a half years as a Regional Consultant. He received his MBA in Quantitative Finance, Accounting, and Economics from NYU’s Stern School of Business in 2010, and he received his bachelor’s degree from Colgate University in Economics in 2006. Christopher is a holder of the Chartered Financial Analyst Designation.


