

Passive Wins Again—But the Smartest Passive Strategy May Be Quality Value
Published March 27, 2025

Christopher Gannatti, CFA
Global Head of Research
Key Takeaways
- In 2024, 65% of U.S. large-cap active managers underperformed the S&P 500 Index, reinforcing the persistent challenge active funds face in beating passive benchmarks.
- Cap-weighted indexing has structural flaws—like overweighting overvalued stocks—but integrating fundamental metrics such as gross profitability helps reintroduce fundamentals and avoid valuation traps.
- WisdomTree’s Quality Dividend Growth strategies showed resilience in market drawdowns and delivered higher Sharpe ratios over multiple periods, offering a smarter way to stay passive while targeting long-term outperformance.
The 2024 SPIVA report once again delivered an unsurprising verdict: active management failed to keep pace with passive investing. In U.S. large-cap equities, 65% of active funds underperformed the S&P 500 Index over the year, with an even more dismal 20-year number—nearly 92% of managers failed to beat the benchmark.1 In a Financial Times opinion piece, Burton Malkiel declared, "Passive investing wins again," echoing a theme he and other efficient market theorists have long championed.2
But for investors seeking an edge, a natural question follows: if pure indexing is the default winner, is there a way to refine passive investing without drifting into more costly active territory? The answer, increasingly, may lie in what Robert Novy-Marx calls the "other side of value": investing in high-quality firms without paying premium prices.3 Quality, especially when measured by gross profitability—emerges as a powerful, academically validated dimension that improves outcomes without abandoning the core tenets of passive investing.
SPIVA 2024: Active Still Trails across the Board
The latest SPIVA data shows that underperformance among active managers remains a structural problem, not a cyclical one. Large-cap managers underperformed in 2024 (65%) and in nearly every rolling period over the past two decades. The long-term statistics are damning: over the past 20 years, only 8% of U.S. large-cap funds have outperformed the S&P 500 Index on a net-of-fees basis. Similar trends hold in mid-cap, small cap and fixed income, with short-term exceptions that have rarely persisted.4
As Malkiel notes, even in a year dominated by the so-called Magnificent Seven and a highly concentrated equity market, active managers still failed to exploit the opportunity. Fee drag, style drift and adverse selection remain persistent hurdles. Indexing, with its low cost and discipline, continues to win by default.
The Flaw in Cap-Weighted Indexing: Structural Over-Weights
However, traditional indexing is not without flaws. Cap-weighted benchmarks mechanically allocate more capital to the most expensive stocks, potentially exacerbating momentum and concentration. By design, they place the greatest weight in market darlings at their largest market capitalizations, and often peak valuations. This structure ignores underlying business fundamentals and can lead to poor capital allocation at the margin. We have noted how in March 2000, the U.S. equity market was dominated by large technology-oriented companies with extremely high valuations, as one example.
As Novy-Marx points out, the essence of value investing is acquiring productive capacity at a reasonable price. Buying high-quality businesses at fair prices is just as much value investing as buying average businesses at cheap prices. We wrote about how Warren Buffett famously shifted from focusing on businesses solely because they had excessively low valuations to focusing on great businesses as reasonable prices. It's the same idea expressed differently. The quality factor—especially as captured through gross profitability—addresses a key weakness in cap-weighted indexing: it reintroduces economic fundamentals into portfolio construction.
Why Gross Profitability Matters
Traditional metrics like return on equity (ROE) and earnings yield often fail to capture true business quality due to accounting distortions. Gross profitability, by contrast, is less susceptible to earnings manipulation and reflects operational efficiency directly. High gross profitability firms tend to reinvest heavily in intangibles (e.g., R&D, brand, human capital), which depresses net income but increases future earnings power.5
Investors frequently underappreciate these firms, leading to persistent mispricing. Quality strategies built on gross profitability exploit this behavioral bias while maintaining systematic, rules-based implementation. For passive allocators seeking more than beta, this is a high signal-to-noise input.
Combining Quality and Value: Sharper, Smarter Passive
Running separate value and quality portfolios improves diversification but can be inefficient. Novy-Marx demonstrates that integrated strategies—selecting stocks based on combined value and quality ranks—have delivered higher factor exposure than holding value and quality sleeves independently.6
At WisdomTree, we developed a quality dividend growth framework that was first deployed in a strategy in 2013. We have two, longstanding, U.S. equity strategies7:
- The WisdomTree U.S. Quality Dividend Growth Fund (DGRW) is designed to track the total return performance, before fees and expenses, of the WisdomTree U.S. Quality Dividend Growth Index. The focus is on dividend-paying companies that have high ROE and return on assets (ROA) metrics, as well as strong forward-looking earnings growth expectations. Weighting is based on indicated cash dividends. The selection element emphasizes the quality and the weighting element emphasizes value.
- The WisdomTree U.S. SmallCap Quality Dividend Growth Fund (DGRS) is designed to track the total return performance, before fees and expenses, of the WisdomTree U.S. SmallCap Quality Dividend Growth Index. The focus is on small market capitalization dividend-paying companies that have high ROE and ROA metrics, as well as strong forward-looking earnings growth expectations. Weighting is based on indicated cash dividends. Again, the selection element emphasizes the quality and the weighting element emphasizes value.
Figure 1: Performance
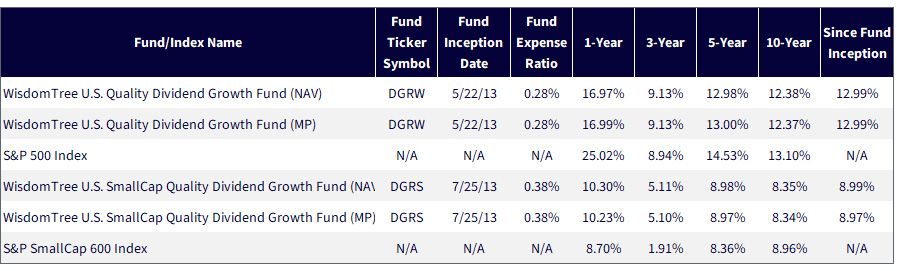
Source: WisdomTree, specifically data from the Fund Comparison Tool in the PATH suite of tools, accessed 3/24/25 with returns as of 12/31/24. NAV denotes total return performance at net asset value. MP denotes market price performance. The performance data quoted represents past performance. Past performance is not indicative of future results. Investment return and principal value of an investment will fluctuate so that an investor's shares, when redeemed, may be worth more or less than their original cost. Current performance may be lower or higher than the performance data quoted. For the most recent month-end and standardized performance, click the relevant ticker: DGRW, DGRS.
10-Years of Strong Returns Punctuated by Some Riskier Periods
We can see in figure 2 that the average annual return of the S&P 500 Index over this 10-year period was 12.4%. Relative to history, this is quite a high number, telling us it was quite a strong equity decade for investors.
However, the year-to-date (YTD) period through March 21, 2025, looks quite different. In looking at figure 2, we draw the following conclusions:
- DGRW did not outperform the S&P 500 Index over every horizon. During the negative return period, YTD 2025, we did see about 200 basis points of outperformance, and we'll come back to this idea of outperforming in a down market later. While DGRW lagged on a one-year basis, the strategy was able to close the gap and perform much more comparably to the S&P 500 Index on a three-, five- and 10-year basis.
- DGRS also did not outperform the S&P SmallCap 600 Index over every horizon. The YTD and one-year periods looked particularly challenging for U.S. small caps. However, on a three- and five-year basis, DGRS was able to outperform the S&P SmallCap 600 Index, and it was able to get close on the 10-year basis.
Figure 2: 10-Years of Strong Returns Punctuated by Some Riskier Periods
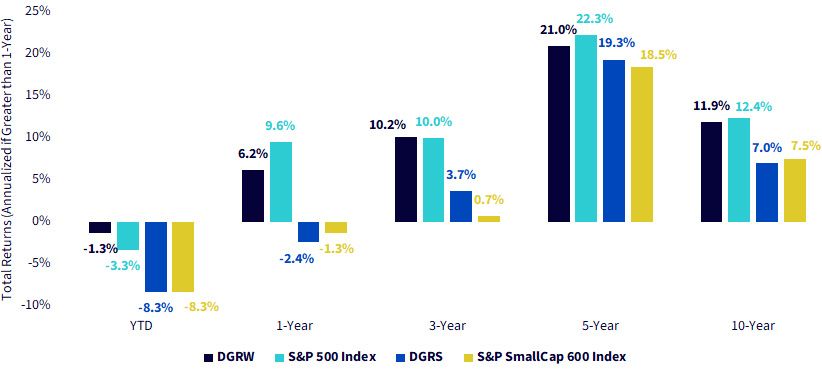
Source: WisdomTree, specifically data from the Fund Comparison Tool in the PATH suite of tools, accessed 3/24/25 with returns as of 12/31/24. NAV denotes total return performance at net asset value. Past performance is not indicative of future results. Investment return and principal value of an investment will fluctuate so that an investor's shares, when redeemed, may be worth more or less than their original cost. Current performance may be lower or higher than the performance data quoted. For the most recent month-end and standardized performance, click the relevant ticker: DGRW, DGRS.
The Power of the Sharpe Ratio
The Sharpe ratio offers a more complete lens: it measures how efficiently a strategy converts risk into return. In an environment characterized by episodic volatility, interest rate uncertainty and rolling sector leadership, risk-adjusted performance is arguably more important than absolute returns.
Figure 3: Beyond Raw Returns into a Risk-Adjusted Comparison
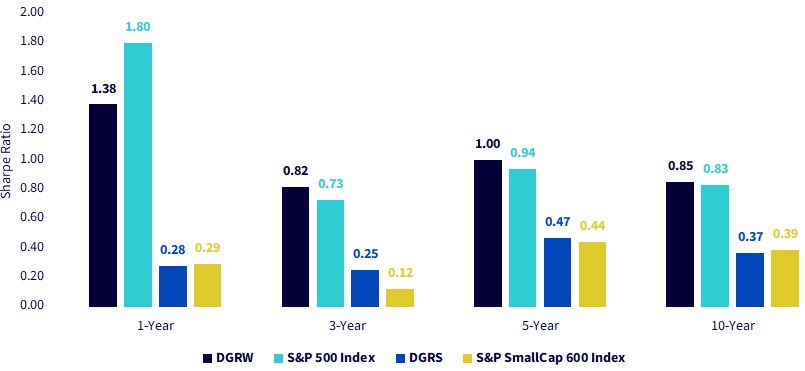
Source: WisdomTree, specifically data from the Fund Comparison Tool in the PATH suite of tools, accessed 3/24/25 with returns as of 12/31/24. NAV denotes total return performance at net asset value. Past performance is not indicative of future results. Investment return and principal value of an investment will fluctuate so that an investor's shares, when redeemed, may be worth more or less than their original cost. Current performance may be lower or higher than the performance data quoted. For the most recent month-end and standardized performance, click the relevant ticker: DGRW, DGRS.
The Rubber Meets the Road in Down Markets
One of the critical aspects of any investment strategy is a return profile that helps investors hold fast in a period of negative returns. If we use history as our guide, we can look at past periods where the benchmarks—the S&P 500 and S&P SmallCap 600 indexes—had more significant drawdowns, and we can see whether DGRW or DGRS were able to outperform in these tougher environments. In the following figures, we calculated the worst 10 drawdowns for these two market capitalization-weighted benchmarks and then cross referenced for periods during which DGRW and DGRS had live returns. These figures show:
- In Figure 4a, DGRW outperformed the S&P 500 Index during each of the drawdowns. The period in 2022 showcased the widest margin, and we note that this was a very tough year for U.S. investors when both U.S. equities and U.S. fixed income were generating negative returns.
- In Figure 4b, we see that DGRS outperformed the S&P SmallCap 600 Index during each of the drawdowns. In the two more significant drawdowns, the outperformance gap was indeed more significant.
Figure 4a: DGRW Outperformed the S&P 500 Index in Drawdown Periods
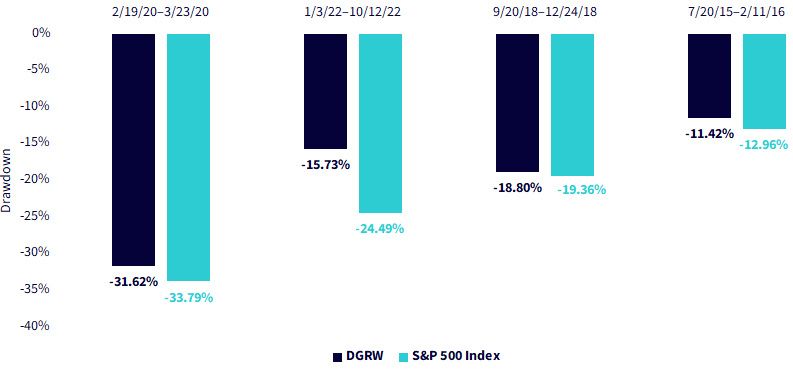
Source: WisdomTree, specifically data from the Fund Comparison Tool in the PATH suite of tools, accessed 3/24/25 with returns as of 12/31/24. NAV denotes total return performance at net asset value. Periods represented by the 10 worst drawdowns for the S&P 500 Index where DGRW also had live performance history, for which there were 4. Past performance is not indicative of future results. Investment return and principal value of an investment will fluctuate so that an investor's shares, when redeemed, may be worth more or less than their original cost. Current performance may be lower or higher than the performance data quoted. For the most recent month-end and standardized performance, click the relevant ticker: DGRW, DGRS.
Figure 4b: DGRS Outperformed the S&P SmallCap 600 Index in Drawdown Periods
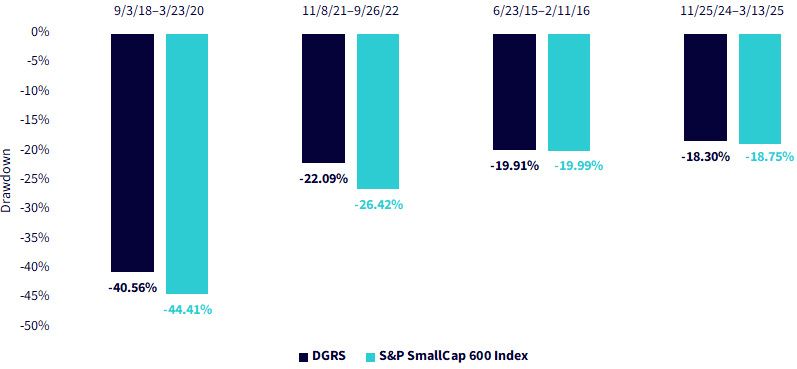
Source: WisdomTree, specifically data from the Fund Comparison Tool in the PATH suite of tools, accessed 3/24/25 with returns as of 12/31/24. NAV denotes total return performance at net asset value. Periods represented by the 10 worst drawdowns for the S&P SmallCap 600 Index where DGRS also had live performance history, for which there were 4. Past performance is not indicative of future results. Investment return and principal value of an investment will fluctuate so that an investor's shares, when redeemed, may be worth more or less than their original cost. Current performance may be lower or higher than the performance data quoted. For the most recent month-end and standardized performance, click the relevant ticker: DGRW, DGRS.
Conclusion: Passive Is Evolving
The debate is no longer passive versus active. It's standard, market capitalization-weighted passive versus smarter passive. SPIVA continues to show that traditional active management cannot consistently deliver value. But academic research shows we can do better than blind cap weighting.
Integrating quality, especially gross profitability—into value-based selection offers a compelling middle path. It's empirically robust, low turnover and easily systematized. Investors who want to stay passive but be smarter about it should consider adopting the tools of quality value.
Figure 5: Additional Fund Information
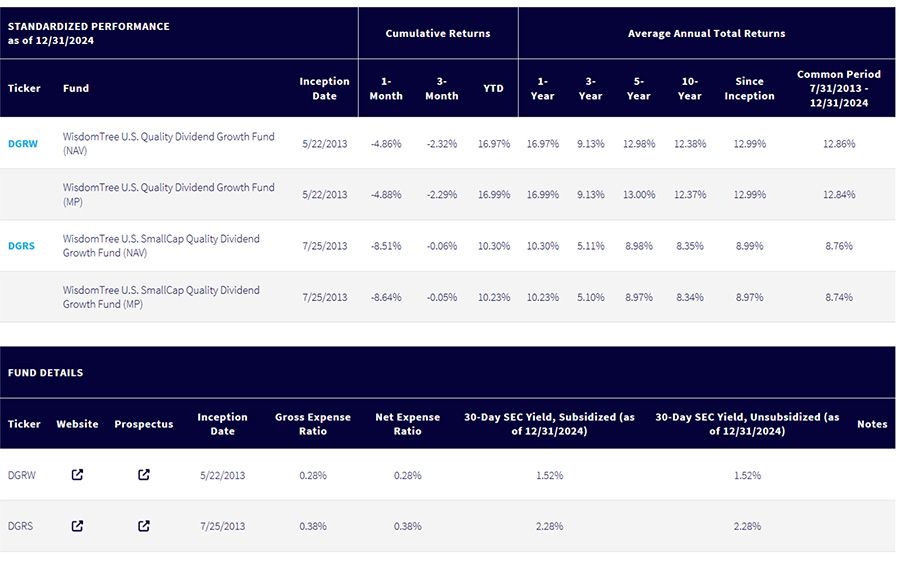
Source: WisdomTree, as of 12/31/24. NAV denotes total return performance at net asset value. MP denotes market price performance. Past performance is not indicative of future results. Investment return and principal value of an investment will fluctuate so that an investor's shares, when redeemed, may be worth more or less than their original cost. Current performance may be lower or higher than the performance data quoted. For the most recent month-end and standardized performances, click the respective ticker: DGRW, DGRS.
1 Source: Ganti et al., "SPIVA U.S. Scorecard," S&P Dow Jones Indices, data as of 12/31/24.
2 Source: Burton Malkiel, "Passive Investing Wins Again," Financial Times, 3/22/25.
3 Source: Robert Novy-Marx "The Other Side of Value: The Gross Profitability Premium," NBER, December 2011.
4 Source: Ganti et al., 12/31/24.
5 Source: Novy-Marx, December 2011.
6 Source: Novy-Marx, December 2011.
7 Here we refer to the WisdomTree U.S. Quality Dividend Growth Fund (DGRW), inception date 5/22/13, and the WisdomTree U.S. SmallCap Quality Dividend Growth Fund (DGRS), inception date 7/25/2013. These strategies both started in 2013, focus only on U.S. equities, and invest in quality dividend-payers, which we focus on here.
Important Risks Related to this Article
There are risks associated with investing, including the possible loss of principal. Funds focusing their investments on certain sectors and/or smaller companies increase their vulnerability to any single economic or regulatory development. This may result in greater share price volatility. Dividends are not guaranteed, and a company currently paying dividends may cease paying dividends at any time. Please read each Fund’s prospectus for specific details regarding the Fund’s risk profile.
Categories
Related articles

About the contributor

Christopher Gannatti, CFA
Global Head of Research
Christopher Gannatti began at WisdomTree as a Research Analyst in December 2010, working directly with Jeremy Schwartz, CFA®, Director of Research. In January of 2014, he was promoted to Associate Director of Research where he was responsible to lead different groups of analysts and strategists within the broader Research team at WisdomTree. In February of 2018, Christopher was promoted to Head of Research, Europe, where he was based out of WisdomTree’s London office and was responsible for the full WisdomTree research effort within the European market, as well as supporting the UCITs platform globally. In November 2021, Christopher was promoted to Global Head of Research, now responsible for numerous communications on investment strategy globally, particularly in the thematic equity space. Christopher came to WisdomTree from Lord Abbett, where he worked for four and a half years as a Regional Consultant. He received his MBA in Quantitative Finance, Accounting, and Economics from NYU’s Stern School of Business in 2010, and he received his bachelor’s degree from Colgate University in Economics in 2006. Christopher is a holder of the Chartered Financial Analyst Designation.