WTAI
Artificial Intelligence and Innovation Fund

Published June 28, 2024

Global Head of Research
At WisdomTree, we built our “Thematic Universe” in 2021, which is a way to track the myriad ETFs that we believe to be focused on various thematic topics. Having this database gives us an insight into what types of topics and ETFs U.S. investors are buying and selling.
This monthly report is available here.
In 2024, when we look at Nvidia’s results and share price performance, it feels like we are watching history. In March 2024, we were writing about Nvidia hitting $2 trillion in market capitalization and how certain ETFs had an exposure to this stock greater than 10%.
If we are honest, when we wrote those words that were published on March 15, 2024, we were not expecting to turn around in roughly three months and see Nvidia at a $3 trillion market capitalization. Microsoft and Apple were the only companies to have ever achieved that milestone in the U.S., at least as of that point.1
And yet, not only has Nvidia eclipsed the $3 trillion milestone, but we have also seen:2
We wanted to refresh our analysis to show investors the strategies with the biggest exposure to Nvidia, just as we did back in March 2024, especially with the continuation of Nvidia’s run of share price performance.
For this analysis, we sought out U.S. ETFs that, as of May 31, 2024, had:3
Figure 1 indicates the standardized returns of these six ETFs as of March 31, 2024. A few things become immediately apparent:
Figure 1 starts pushing us in a direction where, if we can look under the hood of SMH and BOTZ and understand the differences, it may help us have a greater understanding of the spectrum of returns of these Funds.
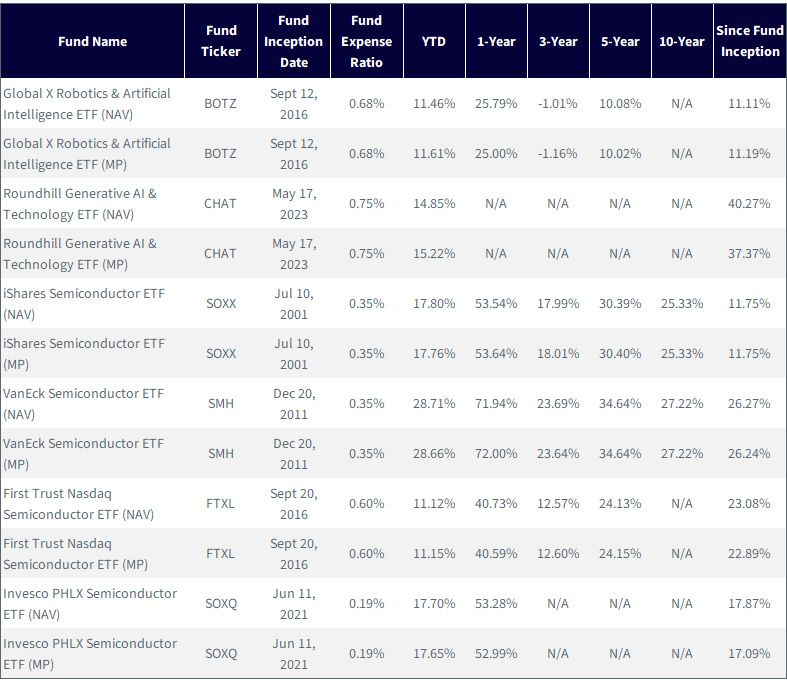
Source: WisdomTree, specifically data from the Fund Comparison Tool in the PATH suite of tools, as of 3/31/24. NAV denotes total return performance
at net asset value. MP denotes market price performance. Past performance is not indicative of future results. Investment return and principal
value of an investment will fluctuate so that an investor’s shares, when redeemed, may be worth more or less than their original cost.
Current performance may be lower or higher than the performance data quoted. For the most recent month-end and standardized
performance and to download the respective Fund prospectuses, click the relevant ticker: BOTZ, CHAT, SOXX, FTXL, SOXQ.
When one does an analysis like this, the “Top 10” is where it becomes visible just how heavily weighted to Nvidia the individual strategies have been. We recognize that since the launch of ChatGPT in November 2022, the maxim “the more weight to Nvidia, the better the return” has been accurate. However, it’s also true that past performance is not indicative of future returns—a sentence you might have seen before peppered throughout any investment literature you’ve ever read.
From a returns perspective, it is globally known that Nvidia has been incredible. Any knowledge we assemble from this point has to be aimed toward increasing our understanding of what may happen in the future.
In figure 2:
It is, therefore, clear that SMH’s superior results may have been helped by a substantially greater weight to Nvidia during a time when this stock was at a historic share price run. It is not yet clear why BOTZ has tended to trail significantly on a returns basis relative to SOXX and FTXL, which also had lower Nvidia weights.
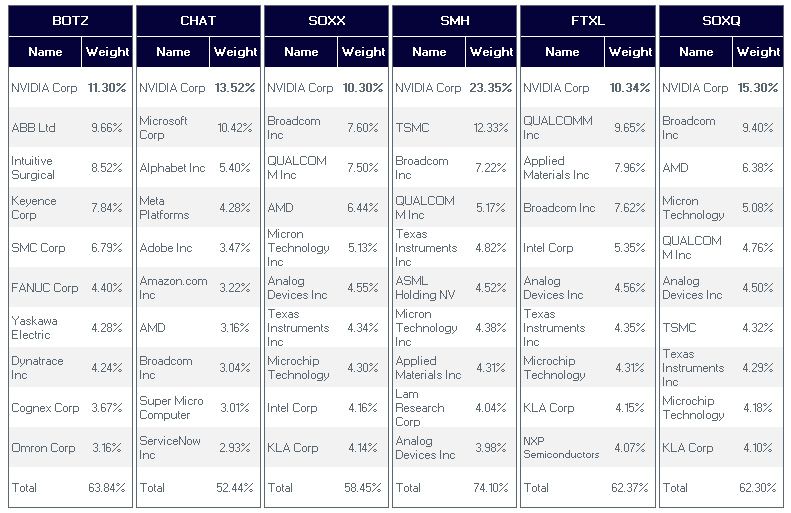
Sources: WisdomTree, FactSet, as of 5/31/24. Holdings subject to change. For the most recent month-end standardized performance and to
download the respective Fund prospectuses, please visit the respective sponsor websites and Fund home pages. For the most recent
month-end and standardized performance and to download the respective Fund prospectuses, click the relevant ticker: BOTZ, CHAT, SOXX,
FTXL, SOXQ.
As we look at these strategies in figure 2, the word “concentration” cannot be far from one’s mind. The lowest combined weight in the top 10 was CHAT, at 52.44%. The highest overall weight in the top 10 was SMH, at 74.10%. Most were clustered between 58% and 64% of weight in the top 10.
With this much weight in the top 10, if we can indicate a measure of how many strategies have the same stocks in the top 10, we get a summary view of how similar they might be, at least on a holdings basis. That is what we seek to do in figure 3:
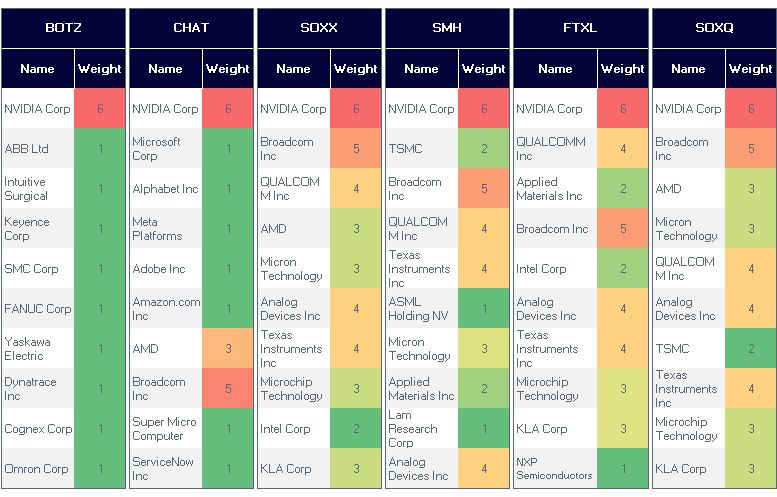
Sources: WisdomTree, FactSet, as of 5/31/24. Holdings subject to change. For the most recent month-end standardized performance and to
download the respective Fund prospectuses, please visit the respective sponsor websites and Fund home pages. For the most recent
month-end and standardized performance and to download the respective Fund prospectuses, click the relevant ticker: BOTZ, CHAT,
SOXX, FTXL, SOXQ.
Finally, we can discuss the bottom-line, year-to-date 2024 performance through June 14, 2024. When many people are contemplating allocations at the year’s halfway mark, they might be looking at metrics such as this. We’d note in figure 4:
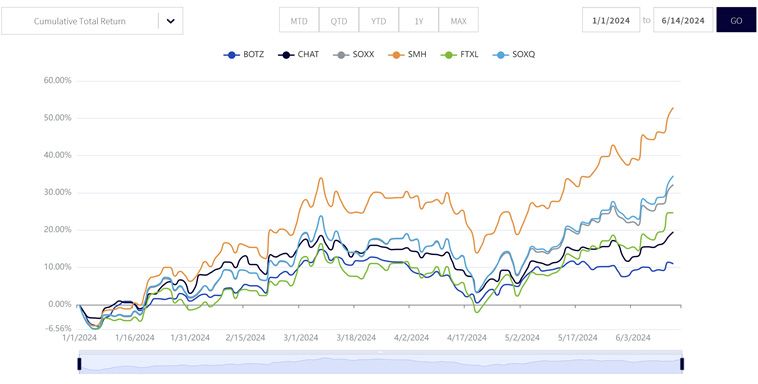
Source: WisdomTree, specifically data from the Fund Comparison Tool in the PATH suite of tools, for the period 1/1/24 to 6/14/24. NAV denotes
total return performance at net asset value. MP denotes market price performance. Past performance is not indicative of future results.
Investment return and principal value of an investment will fluctuate so that an investor’s shares, when redeemed, may be worth
more or less than their original cost. Current performance may be lower or higher than the performance data quoted. For the most
recent month-end standardized performance and to download the respective Fund prospectuses, please visit the respective sponsor
websites and Fund home pages. For the most recent month-end and standardized performance and to download the respective Fund
prospectuses, click the relevant ticker: BOTZ, CHAT, SOXX, FTXL, SOXQ.
We find it important to always ask this question with reference to the present period—June 2024 as we write these words—because if you are making decisions, you can only do so in the present. We all know that it WAS a great move, returns-wise, to maximize exposure to Nvidia from roughly late November 2022 to June 2024, but this doesn’t help us in deciding what to do over the next 18 or so months.
Some might be wondering—where is the WisdomTree strategy? Well, when we rebalanced the WisdomTree Artificial Intelligence & Innovation Index, which is tracked by the WisdomTree Artificial Intelligence & Innovation Fund (WTAI), we only allocated 2.3% weight to Nvidia in May 2024.10 The lowest weights to Nvidia that we saw within the six strategies in this piece were about 8% higher. WTAI is designed with a diversified exposure to a broad AI ecosystem in mind, so the strategy cannot place undue weight in any one company, and furthermore, it can be difficult to jump onto a momentum train 18 months into a rally.
So far, not placing more weight to Nvidia has detracted from relative returns, but we remind investors that the AI story, if it really works, is a 10- to 15-year journey that will not be fully known by the end of 2024 or even in 2025. We expect a lot of topics to come into and fade out of prominence, so we believe in more of a broad-based approach for the coming years.
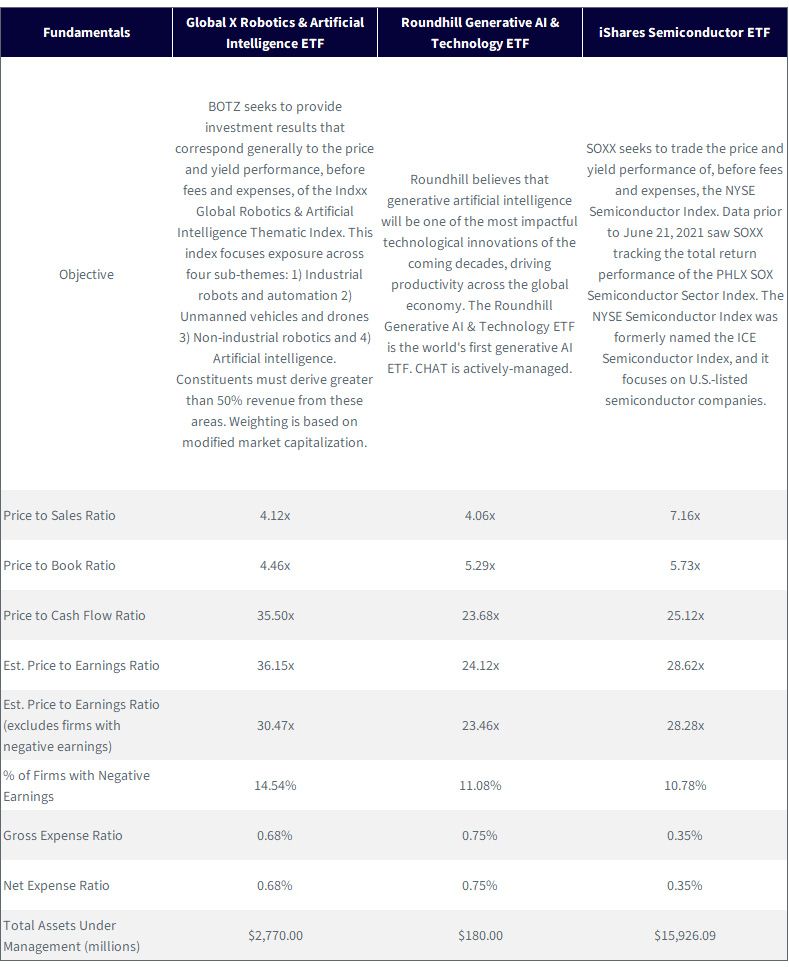
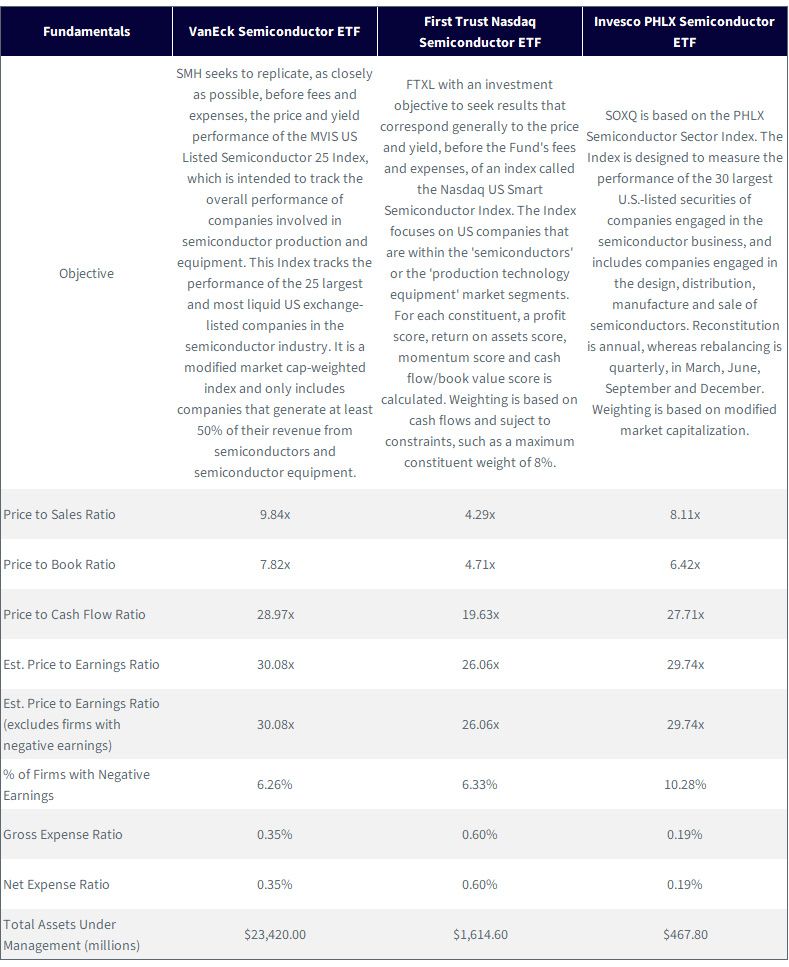
Source: WisdomTree, specifically the Fund Compare Tool, with data quoted as the most recently available as of 6/16/24. Due to certain complexities of
fundamental aggregation, the Price-to-Sales, Price-to-Book, Price-to-Cash-Flow, Estimated (Est.) Price-to-Earnings and Est. Price-to-Earnings (excludes
firms with negative earnings) Ratios and % of Firms with Negative Earnings Statistics are as of 5/31/24. Total Expense Ratio and Total Assets Under
Management are current as of 6/14/24 (most recent market close as of 6/16/24), with these measures taken from specific Fund websites.
If you are interested in diving more into the comparison of these Funds, please check out our Fund Comparison Tool.
1 Source: Anita Hamilton and Adam Clark, “Nvidia Reaches $3 Trillion Market Value. It’s the Latest Sign of Chip Demand,” Barron’s, 6/5/24.
2 Sources: WisdomTree, Morningstar, Bloomberg. All data as of 5/31/24 and based on WisdomTree’s internal classification of thematic funds. Performance is based on monthly returns from Bloomberg and Morningstar. Historical performance is not an indication of future performance, and any investments may go down in value.
3 Sources: WisdomTree, FactSet, with data as of 5/31/24.
4 Sources: Global X, Indxx Global Robotics & Artificial Intelligence Thematic Index Methodology document, January 2023 update.
5 Source: Roundhill Investments, accessed on 6/16/24.
6 Source: iShares.
7 Sources: VanEck, Market Vector MVIS US Listed Semiconductor 25 Index Guidebook, May 2024 Update.
8 Sources: First Trust, Nasdaq US Smart Sector Index methodology document, 2023 Update.
9 Sources: Invesco, PHLX Semiconductor Sector Index methodology, 2024 Update.
10 New portfolio positions in WTAI and the WisdomTree Artificial Intelligence & Innovation Index took effect after the close on May 17, 2024, and began trading at the open on May 20, 2024.
For current holdings of WTAI, please click here. Holdings are subject to risk and change.
There are risks associated with investing, including the possible loss of principal. The Fund invests in companies primarily involved in the investment theme of artificial intelligence (AI) and innovation. Companies engaged in AI typically face intense competition and potentially rapid product obsolescence. These companies are also heavily dependent on intellectual property rights and may be adversely affected by loss or impairment of those rights. Additionally, AI companies typically invest significant amounts of spending on research and development, and there is no guarantee that the products or services produced by these companies will be successful. Companies that are capitalizing on innovation and developing technologies to displace older technologies or create new markets may not be successful. The Fund invests in the securities included in, or representative of, its Index regardless of their investment merit, and the Fund does not attempt to outperform its Index or take defensive positions in declining markets. The composition of the Index is governed by an Index Committee, and the Index may not perform as intended. Please read the Fund’s prospectus for specific details regarding the Fund’s risk profile.
Artificial Intelligence and Innovation Fund

Global Head of Research
Christopher Gannatti began at WisdomTree as a Research Analyst in December 2010, working directly with Jeremy Schwartz, CFA®, Director of Research. In January of 2014, he was promoted to Associate Director of Research where he was responsible to lead different groups of analysts and strategists within the broader Research team at WisdomTree. In February of 2018, Christopher was promoted to Head of Research, Europe, where he was based out of WisdomTree’s London office and was responsible for the full WisdomTree research effort within the European market, as well as supporting the UCITs platform globally. In November 2021, Christopher was promoted to Global Head of Research, now responsible for numerous communications on investment strategy globally, particularly in the thematic equity space. Christopher came to WisdomTree from Lord Abbett, where he worked for four and a half years as a Regional Consultant. He received his MBA in Quantitative Finance, Accounting, and Economics from NYU’s Stern School of Business in 2010, and he received his bachelor’s degree from Colgate University in Economics in 2006. Christopher is a holder of the Chartered Financial Analyst Designation.
