WTPI
Equity Premium Income Fund

Published May 21, 2026

Global Head of Research
The Case for Low Volatility in U.S. Equity Portfolios
For many investors, there is a particular kind of exhaustion that sets in after a market drawdown. It is not just the portfolio loss itself; it is also the compounding anxiety of watching a recovery that feels too slow, the second-guessing of every allocation decision, and the nagging question of whether a smoother path was ever available. For many U.S. equity investors, the answer to that last question is increasingly: usually yes, and here is how to find it.
The search for lower-volatility equity exposure is not new, and minimum-variance strategies have existed since the early 1990s, but investor demand has sharpened considerably as markets have grown more prone to abrupt dislocations.1 The 2020 pandemic shock, the 2022 rate-driven selloff, and the volatility spikes of early 2025 have all reinforced a simple, uncomfortable arithmetic:
Large losses require disproportionately large gains just to break even.
Putting numbers to it, a hypothetical portfolio that drops 30%—for instance, from $100 to $70—needs a 43% recovery to get back to where it started. That asymmetry is the engine behind the enduring appeal of volatility management.
Today, the largest U.S. minimum-volatility-focused strategy is the iShares MSCI USA Min Vol Factor ETF (USMV), with nearly $23 billion in assets and a history stretching back to 2011.2 It seeks to achieve its volatility-reduction objective through sophisticated equity optimization undertaken by the MSCI USA Minimum Volatility Index, which holds a constrained subset of large- and mid-cap U.S. stocks that, in combination, aims to produce the lowest achievable portfolio variance.
The WisdomTree Equity Premium Income Fund (WTPI), by contrast, does not own equities at all. It writes short-dated put options on the S&P 500 Index, collects premium income, and holds U.S. Treasury bills as collateral.
Both strategies mechanically approach the concept of a U.S. equity-oriented exposure, but one defined by lower volatility than a broad-based market capitalization-weighted benchmark, be it the S&P 500 Index or the MSCI USA Index. Importantly, these strategies aims to reach this result through entirely different mechanisms.
Inside USMV: Optimization with Guardrails
USMV tracks the MSCI USA Minimum Volatility Index, which is constructed using a process that is more mathematically intensive than its plain-English description might suggest.3 The index begins with the MSCI USA parent universe—essentially the broad large- and mid-cap U.S. equity market—and runs it through an optimizer powered by the Barra multi-factor risk model. The goal is to find the portfolio of stocks that produces the lowest total variance, subject to a set of constraints designed to keep the result investable and not excessively concentrated.
Those constraints are important and materially influence the results. Without them, a true minimum-variance portfolio would tend to collapse into a handful of highly correlated, very low-beta stocks, useful in theory but tougher to stomach for investors in practice. The MSCI methodology imposes position-level limits (no constituent can exceed 1.5% of the index, or 20 times its weight in the parent index), sector neutrality bands (sector weights can drift no more than five percentage points from the parent), and a quarterly turnover cap of 5% one-way. The result is a diversified, replicable portfolio that has historically delivered lower beta and lower realized volatility than the broad U.S. market, with a tilt toward sectors like utilities, consumer staples, and healthcare that tend to exhibit more stable earnings and cash flows.
The strategy’s strengths are well-documented. In sustained equity selloffs driven by macroeconomic or credit stress, USMV has historically provided meaningful downside cushion. Its equity character also means that in prolonged bull markets, it participates less fully than the cap-weighted index.4 It is, in essence, a lower-octane equity engine:
A potentially smoother ride with somewhat reduced top speed, with top speed defined as participation in upward-trending bull markets.
But USMV, in our opinion, carries a structural limitation that is easy to overlook. Because it is still fundamentally a long-only equity portfolio, it is exposed to broad market beta. In sharp, rapid drawdowns, the kind driven by sudden liquidity shocks or macro surprises rather than gradual deterioration, the low-vol factor can behave more like the broader market than investors expect. Correlation may spike toward one precisely when diversification is most needed, dampening any benefit of holding equities more generally, whether or not they were selected within an overall lower-volatility type of framework.
Inside WTPI: Equity Premium Income from Volatility Itself
WTPI operates on a fundamentally different principle. Rather than selecting lower-volatility stocks, it aims to harvest the equity risk premium in a different form: through the systematic sale of S&P 500 put options. The strategy writes S&P 500 options, targeting at least 2.5% premium income per option cycle. To reduce concentration risk from any single expiration date, the fund maintains two staggered positions, each at roughly 50% of the portfolio, providing a form of diversification across time. The cash collateral backing these positions is invested in U.S. Treasury bills, generating additional income that accrues daily.
The underlying index—the Volos US Large Cap Target 2.5% PutWrite Index—was developed in partnership with WisdomTree and has served as WTPI’s underlying index since October 24, 2022, is designed to deliver enhanced income and reduced volatility relative to traditional put-write benchmarks. The key innovation is the dual-position structure with staggered entry points. A single put-write strategy faces the risk that one bad expiration wipes out multiple cycles of premium income. By splitting into two positions with different roll dates, WTPI dampens the impact of any single adverse expiration event, potentially smoothing the return stream.
The resulting volatility profile is genuinely distinctive. Because WTPI’s returns are driven primarily by option premium income rather than equity price appreciation, its volatility characteristics look different from either the broad market or low-vol equity strategies. The strategy earns steady income in calm markets, gives some of that income back when the market falls sharply (as the puts move into the money), but retains the T-bill yield. In environments where implied volatility is elevated, meaning options are expensive to sell, the strategy can generate outsized premium income that partially offsets drawdown pressure.
A Tale of Two Architectures
The comparison between USMV and WTPI is instructive precisely because the two strategies appear to occupy similar territory, both aiming to deliver equity-like participation with reduced volatility, while actually being structured in ways that make them behave quite differently across market regimes.
Figure 1a illustrates the return picture.
As a reminder, low-volatility strategies are not designed to beat the market; they are designed to deliver a smoother ride. Measured against that objective, both WTPI and USMV have accepted the expected cost of reduced participation in the S&P 500's gains. But within the low-volatility category, the comparison tells a more compelling story.
Across every period shown, including year-to-date, one year, three years, and since October 2022, WTPI has outperformed USMV by a meaningful margin. The gap is most striking over the one-year window, where WTPI’s 20.9% return was roughly four times USMV’s 5.2% return. Over the three-year and since-inception periods, WTPI’s advantage narrows but remains consistent: approximately 3.4 and 3.1 percentage points, respectively.
This persistent spread reflects a structural difference in how each strategy harvests the equity risk premium. WTPI’s option premium income, amplified during periods of elevated implied volatility, has provided a return tailwind that pure equity optimization, USMV's mechanism, has not replicated in this period. Although future results may differ, but it’s notable that the historical picture is showing us this type of return comparison.
Figure 1a: Smoother Path, Stronger Relative Results: WTPI Outpaced USMV Across All Measured Periods
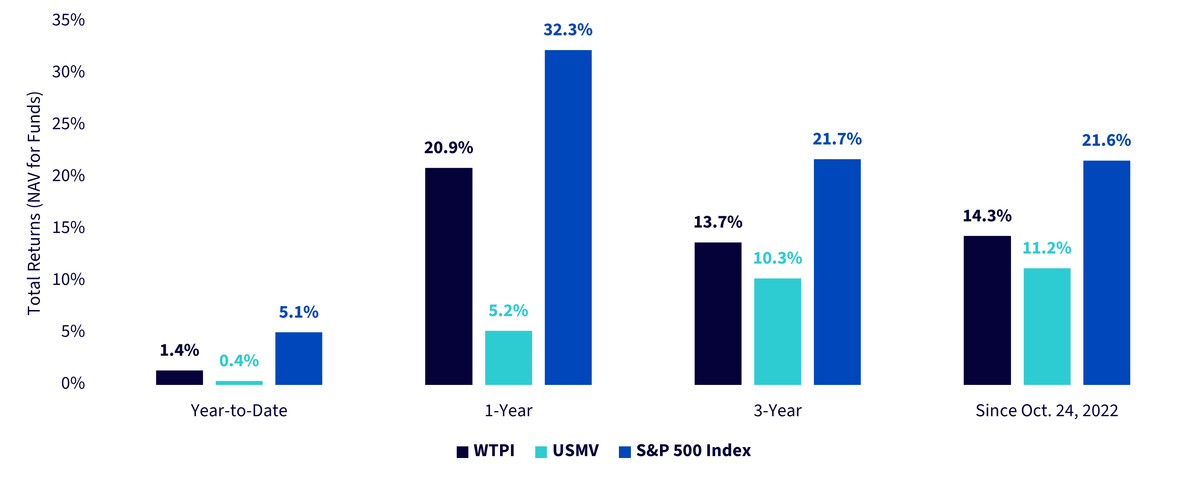
Figure 1b: Standardized Returns
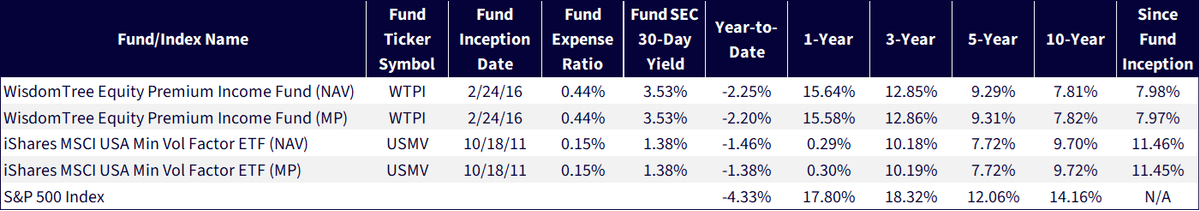
Sources: WisdomTree, FactSet, specifically data from the Fund Comparison Tool in the PATH suite of tools, accessed April 26, 2026 with returns through March 31, 2026. Fund SEC 30-Day Yield as of March 31, 2026. NAV denotes total return performance at net asset value. MP denotes market price performance. Prior to April 04, 2025, WTPI was known as the WisdomTree PutWrite Strategy Fund (PUTW). On that date the fund’s investment policy changed. Prior to October 24, 2022, the WisdomTree PutWrite Strategy Fund was named the WisdomTree CBOE S&P 500 PutWrite Strategy Fund and tracked the total return performance, before fees and expenses, of the CBOE S&P 500 PutWrite Index. Past performance is not indicative of future results. Investment return and principal value of an investment will fluctuate so that an investor’s shares, when redeemed, may be worth more or less than their original cost. Current performance may be lower or higher than the performance data quoted. For the most recent month-end and standardized performance and to download the respective Fund prospectuses, click the relevant ticker: WTPI, USMV.
Let’s Look at a Recent U.S. Equity Drawdown that We All Remember
The tariff shock of April 2025, dubbed “Liberation Day,” delivered one of the year’s sharpest and most sudden equity dislocations, erasing over 11% from the S&P 500 in a matter of days. In that environment, both low-volatility strategies delivered on their core promise of downside mitigation. USMV proved slightly more defensive, declining 8.7% versus WTPI’s 10.0% loss, a result consistent with USMV's lower equity beta profile providing shelter in a rapid, broad-based selloff.
The more striking divergence, however, came in the recovery. As markets rebounded, WTPI captured 31.0%, getting closer to the S&P 500's 38.7% recovery and dramatically outpacing USMV's 11.5%. This asymmetry reflects a key structural dynamic: as implied volatility spiked during the drawdown, WTPI was able to write new put positions at significantly richer premiums, effectively turbocharging its income engine precisely when fear was at its peak. The strategy absorbed the shock and then harvested it. Again, we don’t know that the picture will always come out this way, but it’s important to study known historical periods to test these complex strategies in real time to see how they did.
Figure 2: When Liberation Day Struck, Both Held Up — But Only One Surged Back
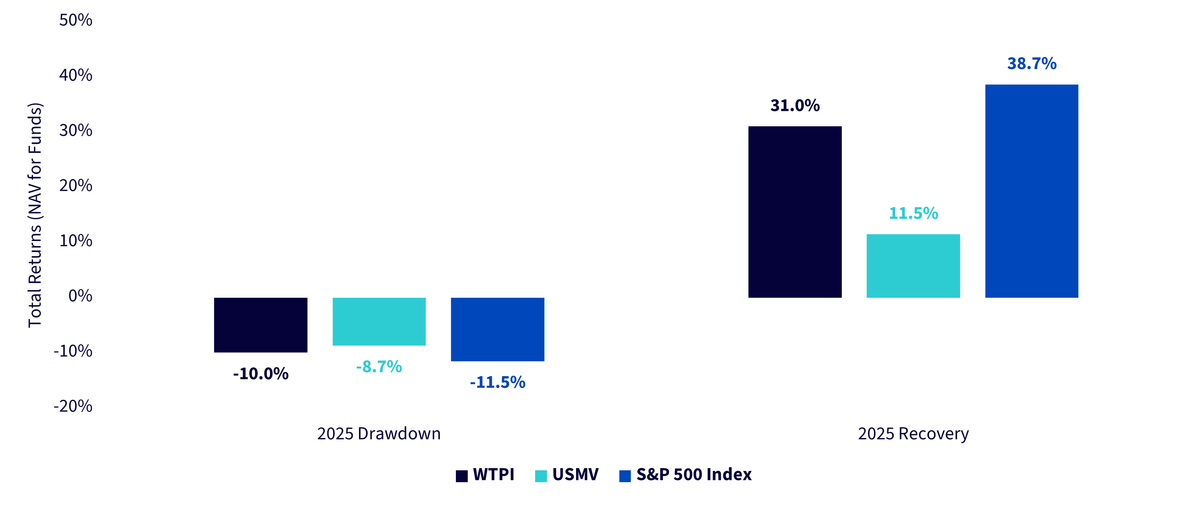
Sources: WisdomTree, FactSet specifically data from the Fund Comparison Tool in the PATH suite of tools, accessed April 26, 2026 with returns as of April 1, 2025 to April 8, 2025 for the 2025 Drawdown and April 8, 2025 to December 31. 2025 for the 2025 Recovery. Returns shown at NAV for funds. Past performance is not indicative of future results.
How About Actual Volatility Reduction?
Return comparisons tell only half the story. The other half is how much turbulence investors absorbed along the way, and here the data reinforces WTPI’s structural advantage in a particularly compelling way.
Over both the one-year and three-year periods, WTPI has registered lower annualized volatility. At 6.1% over one year and 7.8% over three years, WTPI’s realized volatility sits meaningfully below not only the S&P 500's 9.9% and 11.9%, but also below USMV's 7.1% and 9.6%, a strategy explicitly engineered to track an index that has a methodology to minimize portfolio variance.
That result deserves emphasis: USMV's entire underlying index construction, including the Barra optimization, the covariance matrix, and the sector constraints, is designed with one primary goal: lower volatility. Yet WTPI, operating through an entirely different mechanism, has achieved a smoother return stream by an appreciable margin. When combined with WTPI’s superior return profile across the same periods, the risk-adjusted case becomes difficult to dismiss. Although this may not always be the case, the historical record does appear compelling so far.
Figure 3: WTPI Delivered Lower Annualized Volatility Than USMV over 1 & 3 Year Periods
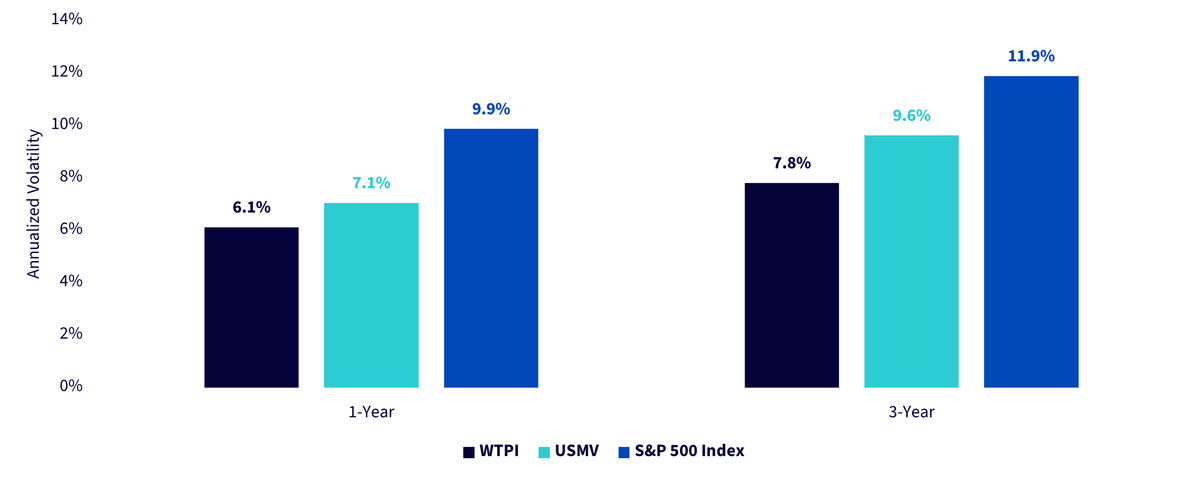
Sources: WisdomTree, FactSet specifically data from the Fund Comparison Tool in the PATH suite of tools, accessed April 26, 2026 with Annualized Volatility measured for the periods shown and as of the period-ended March 31, 2026. Past performance is not indicative of future returns.
Conclusion: Not All Low Volatility Is Created Equal
The search for smoother returns in U.S. equity markets has never been more relevant, and the tools available to investors have never been more varied. USMV represents the established, time-tested approach: equity optimization in service of lower beta. WTPI represents something genuinely different: a strategy that harvests the equity risk premium through option income, generating lower realized volatility, stronger relative returns, and a recovery dynamic that turns market fear into a structural advantage. Across the periods examined, WTPI has not merely kept pace with the category leader; it has redefined what low-volatility investing can look like.
Figure 4: Additional Information
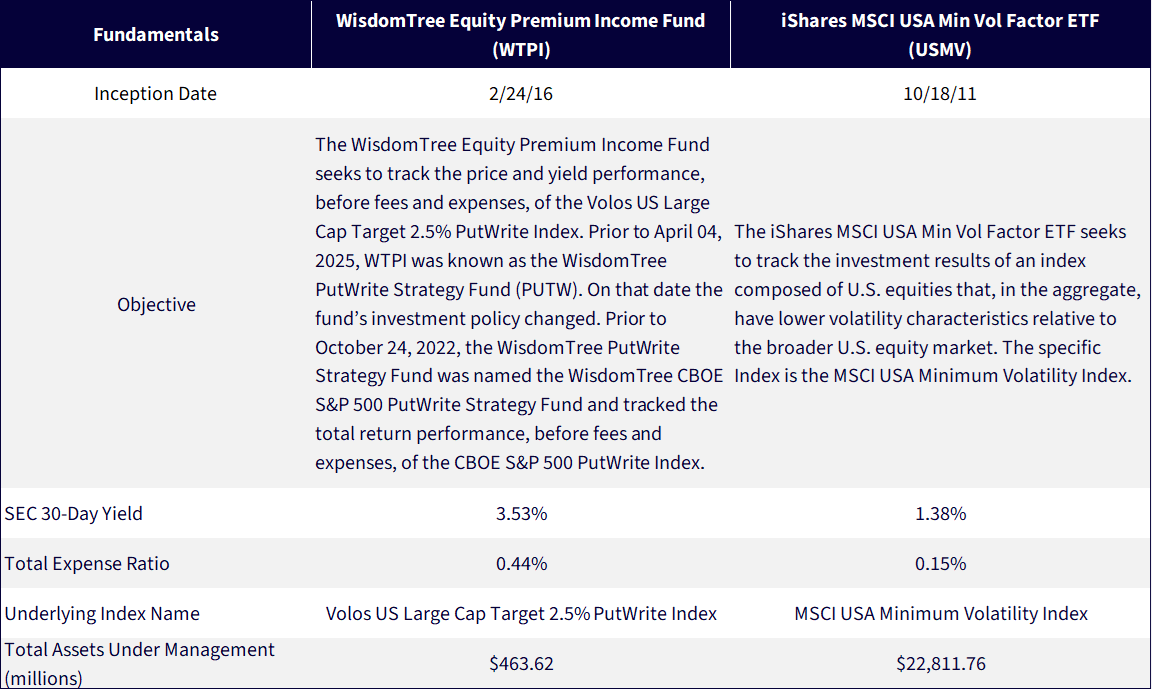
Sources: Specific fund sponsor websites, with Assets Under Management data as of April 24, 2026. Subject to change.
1 Source: Haugen, R. A., & Baker, N. L. (1991). The efficient market inefficiency of capitalization-weighted stock portfolios. Journal of Portfolio Management, 17(3), 35–40.
2 Source: Assets under management from the USMV fund page, with data as of April 24, 2026. Subject to change.
3 Source for MSCI USA Minimum Volatility Index methodology: MSCI Inc. (2025, July). MSCI minimum volatility indexes methodology.
4 Sources: WisdomTree, FactSet and Morningstar, using data from the Fund Compare Tool within WisdomTree’s PATH suite of tools. Returns based analysis can be undertaken back to USMV’s October 2011 inception. Past performance is not indicative of future returns.
There are risks associated with investing, including possible loss of principal. The Fund invests in derivatives, including S&P 500 Index put options (“SPX Puts”). Derivative investments can be volatile, and these investments may be less liquid than securities, and more sensitive to the effects of varied economic conditions. The value of the SPX Puts in which the Fund invests is partly based on the volatility used by market participants to price such options (i.e., implied volatility). The options values are partly based on the volatility used by dealers to price such options, so increases in the implied volatility of such options will cause the value of such options to increase, which will result in a corresponding increase in the liabilities of the Fund and a decrease in the Fund’s net asset value. Options may be subject to volatile swings in price influenced by changes in the value of the underlying instrument. The potential return to the Fund is limited to the amount of option premiums it receives; however, the Fund can potentially lose up to the entire strike price of each option it sells. The Fund invests in the securities included in, or representative of, its Index regardless of their investment merit, and the Fund does not attempt to outperform its Index. Due to the investment strategy of the Fund, it may make higher capital gain distributions than other ETFs. Please read the Fund’s prospectus for specific details regarding the Fund’s risk profile.
For USMV’s risk disclosures, please click here.
Equity Premium Income Fund

Global Head of Research
Christopher Gannatti began at WisdomTree as a Research Analyst in December 2010, working directly with Jeremy Schwartz, CFA®, Director of Research. In January of 2014, he was promoted to Associate Director of Research where he was responsible to lead different groups of analysts and strategists within the broader Research team at WisdomTree. In February of 2018, Christopher was promoted to Head of Research, Europe, where he was based out of WisdomTree’s London office and was responsible for the full WisdomTree research effort within the European market, as well as supporting the UCITs platform globally. In November 2021, Christopher was promoted to Global Head of Research, now responsible for numerous communications on investment strategy globally, particularly in the thematic equity space. Christopher came to WisdomTree from Lord Abbett, where he worked for four and a half years as a Regional Consultant. He received his MBA in Quantitative Finance, Accounting, and Economics from NYU’s Stern School of Business in 2010, and he received his bachelor’s degree from Colgate University in Economics in 2006. Christopher is a holder of the Chartered Financial Analyst Designation.

