

Is it Time to Sell Volatility?
Published October 29, 2024

Christopher Gannatti, CFA
Global Head of Research
Key Takeaways
- With U.S. equity markets near record highs, option-writing strategies like the WisdomTree PutWrite Strategy Fund (PUTW) and the JPMorgan Equity Premium Income ETF (JEPI) offer a way to potentially hedge against rising volatility while generating income.
- PUTW's strategy of selling in-the-money put options on the S&P 500 Index targets higher premiums but increases sensitivity to equity market declines, while JEPI’s approach, selling out-of-the-money call options alongside active stock selection, is more defensive.
- Both strategies have delivered lower volatility and higher risk-adjusted returns than the S&P 500 Index, but each carries distinct risks tied to their exposure and income generation methods.
Investors in U.S. equities, judging by the performance of benchmark indexes, have been treated to a very strong run. The S&P 500 Index, as of this writing, is flirting with new highs.1
We believe there are investors out there who have appreciated the strong equity returns, but who are now battening down the hatches and preparing for potential increases in volatility. Strategies that write options—or, put another way, sell volatility—could be more favorable if this reality comes to pass.
The Morningstar Derivative Income Category
Morningstar places option-writing funds within the derivative income category. As of September 30, 2024, the JPMorgan Equity Premium Income ETF (JEPI) was the largest fund by assets within this category, with more than $36 billion.2 This strategy combines a basket of defensively oriented equities with selling call options against the basket to increase the overall income generation of the fund.
The WisdomTree PutWrite Strategy Fund (PUTW) is different.
- Instead of selling call options, the strategy sells put options.
- Instead of holding an underlying basket of equities, the strategy holds a basket of short-term, U.S. Treasury securities.
While it is tempting to zero in on the selling of put options versus call options as the primary difference, the tricky thing about the world of options is that, if we assume the same underlying—such as the S&P 500 Index—the concept of “put-call parity” means that selling at-the-money puts or at-the-money calls could yield a very similar return.
- The call-writing approach contains underlying equities.
- The put-writing approach contains U.S. Treasury bills.
The primary difference between JEPI and PUTW is that JEPI is employing a strategy of active stock selection in addition to selling the options, whereas PUTW is focused on an S&P 500 Index exposure, at least from an equity perspective.
Figure 1: Average Annual Total Returns
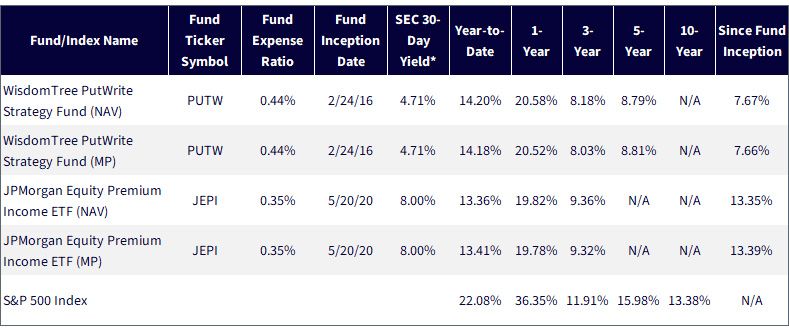
Sources: WisdomTree, LSEG and FactSet, specifically data from the Fund Comparison Tool in the PATH suite of tools, as of 9/30/24. NAV denotes total
return performance at net asset value. MP denotes market price performance. *The 30-Day Yield represents net investment income earned by the Fund
over the 30-Day period ended 10/16/2024, expressed as an annual percentage rate based on the Fund’s share price at the end of the 30-Day period.
Past performance is not indicative of future results. Investment return and principal value of an investment will fluctuate so that an
investor’s shares, when redeemed, may be worth more or less than their original cost. Current performance may be lower or higher than
the performance data quoted. For PUTW’s most recent month-end and standardized performance, click here. Performance of less than
one year is not annualized.
A Capacity for Income Generation
An attribute that many investors appreciate regarding selling options is the income. Even with short-term interest rates currently above 0%, the demand for income-generating investments is always there.
- JEPI is seeking to sell out-of-the-money S&P 500 Index options. These options may have lower premiums, but at the same time they also have lower sensitivity to equity market movements.
With regard to the PUTW's monthly distributions, the following quote comes from the Fund’s prospectus:
“The Fund is managed in a way that seeks, under normal circumstances, to provide monthly distributions at a relatively stable level.”
It makes sense to test how “relatively stable” these distributions have been over the period for which the current strategy has been in place, which began on October 24, 2022.
- There was a more volatile distribution history in 2023, particularly from March 2023 to November 2023.
- From December 2023, onwards, the distribution has been much closer to a 1% level. There is no guarantee that the distribution will always be 1%, but it is a good illustration using data to establish from the actual record how stable it has been.
Figure 2: PUTW’s Distributions as a Percentage of NAV
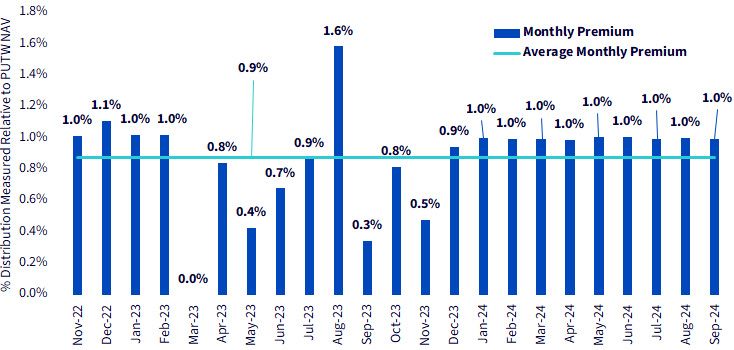
Source: WisdomTree. Prior to 10/24/22, the WisdomTree PutWrite Strategy Fund was named the WisdomTree CBOE S&P 500 PutWrite
Strategy Fund, which accounts for the time period shown in figure 2. Past performance is not indicative of future results. Investment
return and principal value of an investment will fluctuate so that an investor’s shares, when redeemed, may be worth more or
less than their original cost. Current performance may be lower or higher than the performance data quoted. For PUTW’s most
recent month-end and standardized performance, click here.
JEPI notably takes a different approach and it’s important for investors to understand that the dividend yield is merely one characteristic to assess on a given investment. The risk that PUTW employs to generate this income comes with a higher overall exposure to equity market movements—and those movements could very well go in the negative direction, impacting one’s total return.
Figure 3: Trailing 12-Month Fund Dividend Yield
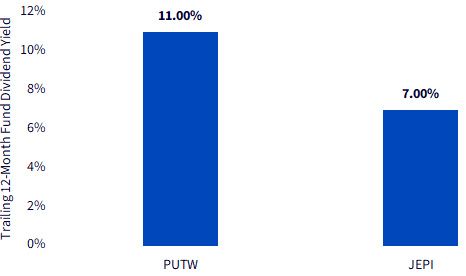
Sources: WisdomTree, LSEG and FactSet, specifically data from the Fund Comparison
Tool in the PATH suite of tools, as of 9/30/24. Past performance is not indicative of
future results. Investment return and principal value of an investment will fluctuate
so that an investor’s shares, when redeemed, may be worth more or less than their
original cost. Current performance may be lower or higher than the performance
data quoted. For PUTW’s most recent month-end and standardized performance,
click here.
Total Returns and Risk
When we look at option-writing strategies, we tend to think that the risk reduction may stand out a bit more relative to the return generation, particularly if one is comparing performance back to a benchmark like the S&P 500 Index. Figure 4 looks at the longest common period based on the inception dates of the different strategies.
- Over this period, the S&P 500 Index has been very strong, generating 18.5% per year with an annualized volatility of 16.4%. We remind people that long-term equity market returns have tended to be closer to 7%–8%3—certainly not above 18%—so this could be one element that leads people to think of higher risk, and lower returns, ahead.
- PUTW had an annualized volatility over this period of 9.8%, whereas JEPI had an annualized volatility of 10.8%. Both of these are significantly below the benchmark’s 16.4%.
Figure 4: Risk & Return
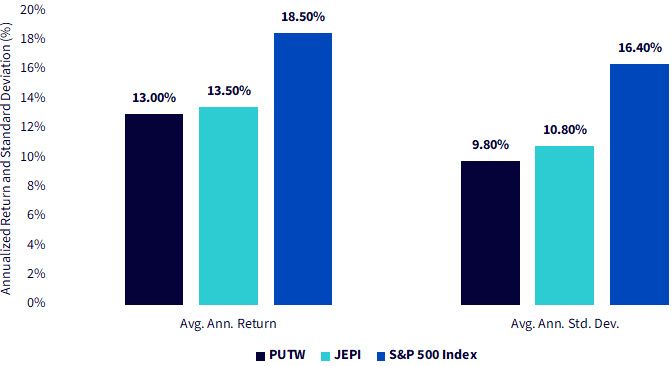
Sources: WisdomTree, LSEG and Factset, specifically data from the Fund Comparison Tool in the PATH suite of tools, for
the period 5/21/20–10/15/24.Calculations shown at NAV. Period selected as the longest available due to the inception date
of JEPI. Past performance is not indicative of future results. Investment return and principal value of an
investment will fluctuate so that an investor’s shares, when redeemed, may be worth more or less than their
original cost. Current performance may be lower or higher than the performance data quoted. For PUTW’s most
recent month-end and standardized performance, click here.
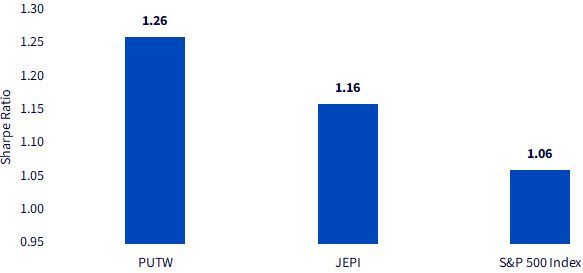
The Sharpe Ratio basically relates the return to the risk and removes the risk-free rate from the return to have the fairest possible comparison. Both PUTW and JEPI had a higher Sharpe Ratio than the S&P 500 Index, even if the index did deliver very strong performance.
Figure 5: Sharpe Ratio
Sources: WisdomTree, LSEG and FactSet, specifically data from the Fund Comparison Tool in the PATH suite of
tools, for the period 5/21/20–10/15/24. Calculations shown at NAV. Period is based on the longest common
period available due to the inception date of JEPI. Past performance is not indicative of future returns.
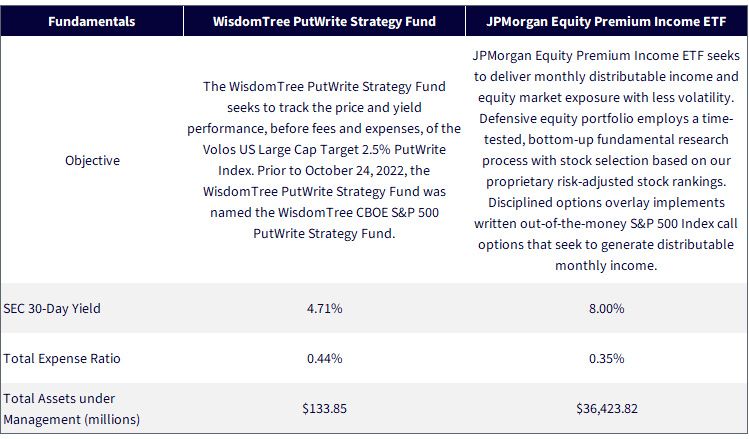
PUTW’s current methodology
If one looks at PUTW's current methodology, one sees the following:
The WisdomTree PutWrite Strategy Fund seeks to track the price and yield performance, before fees and expenses, of the Volos US Large Cap Target 2.5% PutWrite Index.
But this was not always the case. Prior to October 24, 2022, the strategy was tracking the return of the CBOE S&P 500 PutWrite Strategy Index.
The prior approach was selling the at-the-money option on the S&P 500 Index every month. There was no focus on targeting a specific premium—so as the VIX Index fluctuated so did the premium generated. Since the VIX Index tends toward about 15, that means that the premium collected tended toward 1.5% on a monthly basis.
The new approach is targeting a premium of 2.5%, and the way to get there is to sell in-the-money options. The plus side of this is greater income potential. The minus side is greater equity market sensitivity with the sale of in-the-money options.
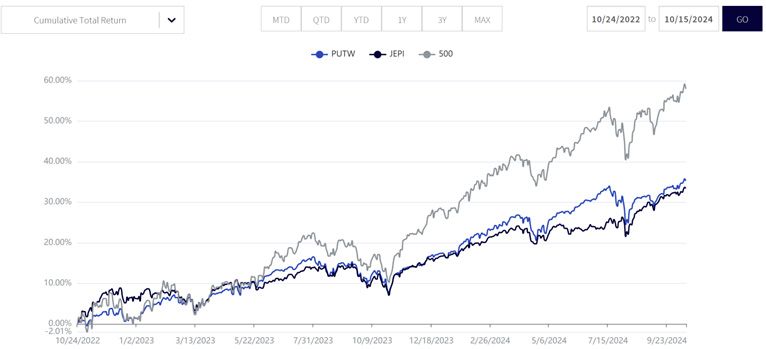
Figure 6 seeks to focus purely on the period of time for which this new methodology was in place for PUTW. We see some outperformance of PUTW over JEPI—but we cannot guarantee that this will always be the case. If one is looking to set a baseline of expectations between these two strategies:
- To the extent that PUTW has equity market exposure, that exposure is based on the S&P 500 Index. Whether such styles as value or growth are outperforming doesn’t matter—it’s all about the benchmark.
Figure 6: Track Record under Current Methodology
Sources: WisdomTree, LSEG and FactSet, specifically data from the Fund Comparison Tool in the PATH suite of tools, as of 10/16/24. Calculations
shown at NAV. Past performance is not indicative of future results. Investment return and principal value of an investment will fluctuate so
that an investor’s shares, when redeemed, may be worth more or less than their original cost. Current performance may be lower or higher
than the performance data quoted. For PUTW’s most recent month-end and standardized performance, click here.
Conclusion: No Rewards Come without Risk
Option writing strategies can sport very attractive distribution yields, but we caution that looking at yield alone doesn’t tell the full story. Generating greater income necessarily means taking on a different sort of risk.
- JEPI, on the other hand, is undertaking to select a basket of 100 stocks and generate an equity market exposure that is different from that of the S&P 500 Index. As with any stock-selection strategy, it can outperform or underperform in different periods. The history that we are able to see argues that the equity exposure appears more value than growth-oriented.
With equity markets at or near record highs, based on the S&P 500 Index, it may make sense to take a deeper look at strategies that seek to sell volatility.
Figure 7: Important Information
Sources: WisdomTree, LSEG and FactSet, specifically data from the Fund Comparison Tool in the PATH suite of tools, as of 10/16/24. Past
performance is not indicative of future results. Investment return and principal value of an investment will fluctuate so that an
investor’s shares, when redeemed, may be worth more or less than their original cost. Current performance may be lower or
higher than the performance data quoted. For PUTW’s most recent month-end and standardized performance, click here.
1 Source: Derek Saul, “Time High—Up over 65% from 2022 Low,” Forbes, 10/14/24.
2 Source: Morningstar Direct, with data as of 9/30/24.
3 The VIX Index refers to the Cboe Volatility Index.
4 Source: Jeremy J. Siegel & Jeremy Schwartz, Stocks for the Long Run, 6th edition, 2022.
5 The Magnificent 7 refers to Alphabet, Amazon, Apple, Microsoft, Meta Platforms, Nvidia and Tesla.
Important Risks Related to this Article
There are risks associated with investing, including the possible loss of principal. The Fund will invest in derivatives, including S&P 500 Index put options (“SPX Puts”). Derivative investments can be volatile, and these investments may be less liquid than securities, and more sensitive to the effects of varied economic conditions. The value of the SPX Puts in which the Fund invests is partly based on the volatility used by market participants to price such options (i.e., implied volatility). The options values are partly based on the volatility used by dealers to price such options, so increases in the implied volatility of such options will cause the value of such options to increase, which will result in a corresponding increase in the liabilities of the Fund and a decrease in the Fund’s NAV. Options may be subject to volatile swings in price influenced by changes in the value of the underlying instrument. The potential return to the Fund is limited to the amount of option premiums it receives; however, the Fund can potentially lose up to the entire strike price of each option it sells. Due to the investment strategy of the Fund, it may make higher capital gain distributions than other ETFs. Please read the Fund’s prospectus for specific details regarding the Fund’s risk profile.
Categories
About the contributor

Christopher Gannatti, CFA
Global Head of Research
Christopher Gannatti began at WisdomTree as a Research Analyst in December 2010, working directly with Jeremy Schwartz, CFA®, Director of Research. In January of 2014, he was promoted to Associate Director of Research where he was responsible to lead different groups of analysts and strategists within the broader Research team at WisdomTree. In February of 2018, Christopher was promoted to Head of Research, Europe, where he was based out of WisdomTree’s London office and was responsible for the full WisdomTree research effort within the European market, as well as supporting the UCITs platform globally. In November 2021, Christopher was promoted to Global Head of Research, now responsible for numerous communications on investment strategy globally, particularly in the thematic equity space. Christopher came to WisdomTree from Lord Abbett, where he worked for four and a half years as a Regional Consultant. He received his MBA in Quantitative Finance, Accounting, and Economics from NYU’s Stern School of Business in 2010, and he received his bachelor’s degree from Colgate University in Economics in 2006. Christopher is a holder of the Chartered Financial Analyst Designation.