DXJ
Japan Hedged Equity Fund

Published August 14, 2024

Global Chief Investment Officer

Global Head of Research
A major macro story in August has been the sharp appreciation of the yen following the Bank of Japan’s rate hike, as well as the expectations for the Fed to start cutting rates in the U.S.
We often discuss currency hedging as a preferred way to own Japan as one can isolate exposure to the stocks from currency.
But what if you have a bullish view on the yen or just prefer being unhedged? We think more locally oriented small market capitalization stocks (small caps) could be well suited in stronger yen periods.
For some, small caps may bring memories of all the unprofitable companies sitting in the Russell 2000 Index and the higher volatility associated with these more speculative companies.1
The story is quite different in Japan. Let’s review the fundamental story and then focus on recent performance and a way to blend small caps in with other Japan exposure.
When we look at Japan small caps we note that WisdomTree has a specific Index that has been live since June 2006, the WisdomTree Japan SmallCap Dividend Index. This Index selects the smaller-cap, dividend-paying companies in Japan and weights them on the basis of their cash dividends paid on an annual basis.
Considering:
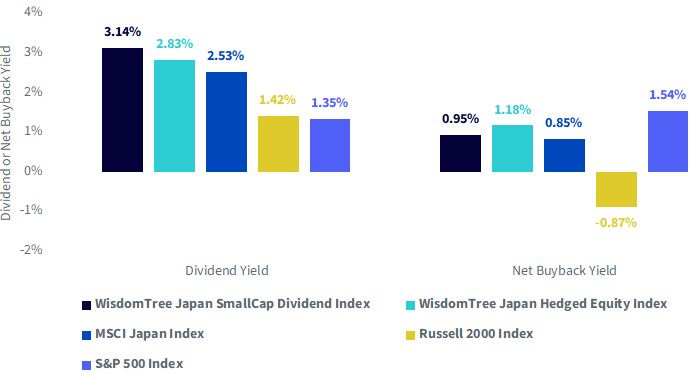
We end up with an Index that has a dividend yield twice that of the aforementioned Russell 2000 Index, shown in figure 1. The Russell 2000 Index is weighted based on market cap and a lot of U.S. small-cap companies do not pay dividends, so this comparison is telling us a key difference between small caps in these markets.
As we were building figure 1, we thought:
All this said, we note that US small caps (Russell 2000 Index) are persistent share issuers due to unprofitable companies having to raise more equity to fund expenses (exemplified by a negative net buyback yield in figure 1). Japan small caps are seeing competitive buybacks with their large-cap peers. The 0.95% net buyback yield for the WisdomTree Japan SmallCap Dividend Index is in the same ballpark as that of the MSCI Japan Index and not too far behind that of the WisdomTree Japan Hedged Equity Index.
Sources: WisdomTree, Bloomberg, FactSet. Data is as of 8/5/24, except in the case of the MSCI Japan Index’s net buyback yield,
where data availability limits this statistic to month-end data as of 6/31/24. You cannot directly invest in an index. Return of capital
is not guaranteed.
Increased dividends and buybacks—the primary avenues of returning cash to shareholders—represents one of our central theses for Japan’s equities. Actions from the Tokyo stock exchange could get companies to raise their price-to-book ratios above 1, thereby forcing change in the board rooms of Japanese companies.2 Small caps have further to go than large caps for further actions.
Small caps are less susceptible to movements in the exchange rate and actually have delivered lower volatility than large caps over recent and long-term history.3
For large exporters, exemplified by a company like Toyota or Tokyo Electron, with large sales occurring outside of Japan, the yen becomes an important factor for earnings growth. These companies are also what most hedge funds and larger global investors trade to get their Japan exposure. This focus can bring more volatility.
To put some investment tools on the table to allow us to measure specific groups of companies:
We had a natural thought—what if a blend of locally oriented and globally oriented Japanese companies could be created?
We sought to consider taking DFJ and DXJ:
We’d emphasize that this is for illustrative purposes seeking to create a baseline from which people can think about diversifying the business focus of different kinds of Japanese companies.
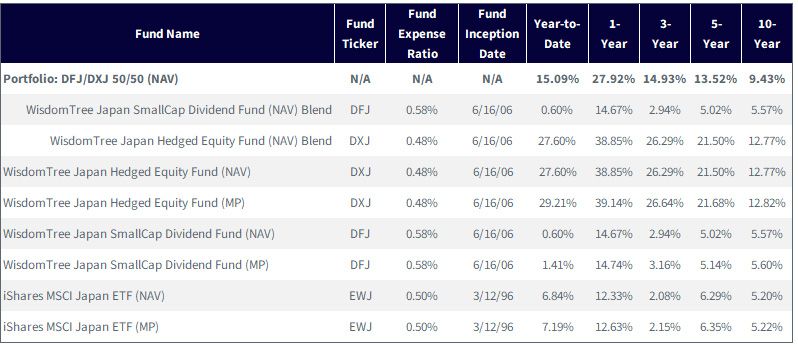
Source: WisdomTree, specifically data from the Fund Comparison Tool in the PATH suite of tools, as of 6/30/24. NAV denotes total return performance at
net asset value. MP denotes market price performance. Past performance is not indicative of future results. Investment return and principal
value of an investment will fluctuate so that an investor’s shares, when redeemed, may be worth more or less than their original cost.
Current performance may be lower or higher than the performance data quoted. For the most recent month-end and standardized
performance and to download the respective Fund prospectuses, click the relevant ticker: DFJ, DXJ, EWJ.
We can see in figure 3:
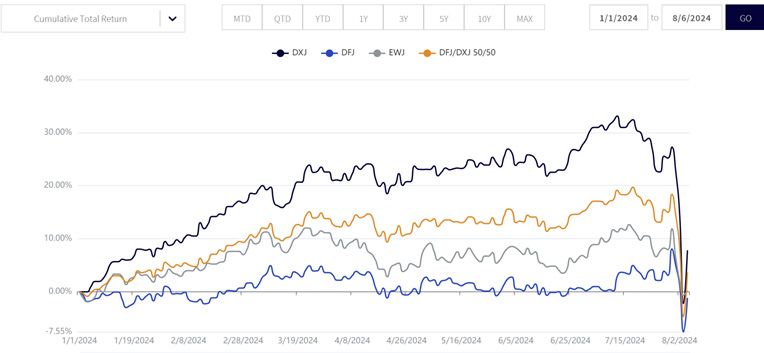
Source: WisdomTree, specifically data from the Fund Comparison Tool in the PATH suite of tools, as of 8/6/24. NAV denotes total return
performance at net asset value. MP denotes market price performance. Past performance is not indicative of future results. Investment
return and principal value of an investment will fluctuate so that an investor’s shares, when redeemed, may be worth more or less
than their original cost. Current performance may be lower or higher than the performance data quoted. For the most recent month-
end and standardized performance and to download the respective Fund prospectuses, click the relevant ticker: DFJ, DXJ, EWJ.
Figure 4 drills down from figure 3 looking at the full year-to-date period to now, the third quarter 2024 to date period. Effectively, it zooms in on the drawdown. We can more clearly see how DFJ and EWJ benefited from being exposed to the yen’s appreciation, which counteracted the drop in equity markets. Of course, the 50/50 DFJ/DXJ blend was somewhere between these and DXJ's return, which experienced the full equity market return with no mitigation.
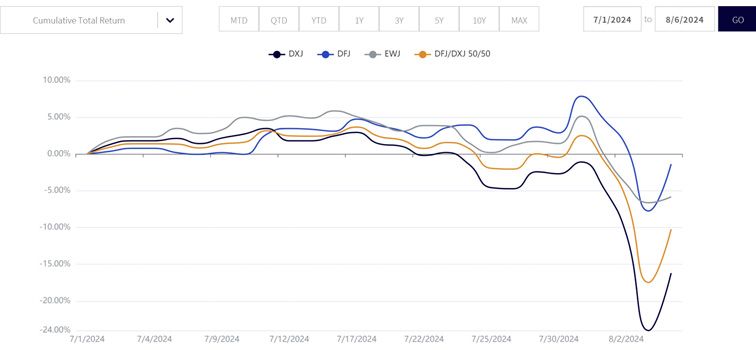
Source: WisdomTree, specifically data from the Fund Comparison Tool in the PATH suite of tools, for the period 7/1/24–8/6/24. NAV denotes total
return performance at net asset value. MP denotes market price performance. Past performance is not indicative of future results. Investment
return and principal value of an investment will fluctuate so that an investor’s shares, when redeemed, may be worth more or less
than their original cost. Current performance may be lower or higher than the performance data quoted. For the most recent month-
end and standardized performance and to download the respective Fund prospectuses, click the relevant ticker: DFJ, DXJ, EWJ.
Are Japanese small caps too exotic? Frequently, “exotic” becomes somewhat of a dirty word in investment strategy depiction because the volatility is so far beyond more familiar exposures. What’s notable is that Japan small caps are one of the lower volatility equity exposures one can include in a portfolio. We show this against the S&P 500 and Russell 2000 indexes—again, because these are measures with which U.S. investors are quite familiar. In figure 5:
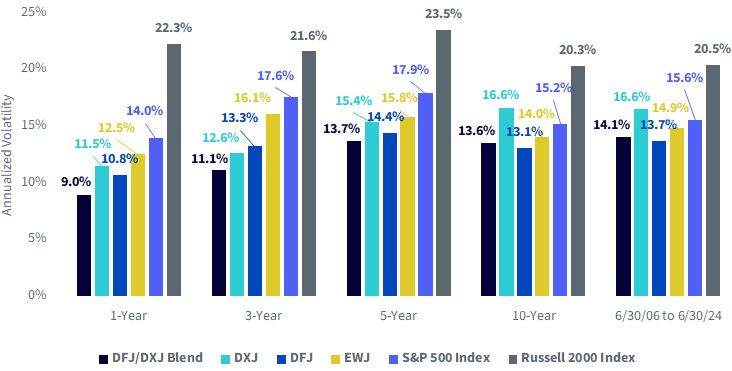
Source: WisdomTree, specifically data from the Fund Comparison Tool in the PATH suite of tools, for the period 6/30/06–6/30/24. NAV
denotes total return performance at net asset value. MP denotes market price performance. You cannot directly invest in an index.
There is another avenue through which people can view Japan’s small caps in order to better think about how risky they may be: Earnings. WisdomTree’s Fund Comparison tool can take different baskets of equities and calculate an array of statistics. In figures 5 and 6, we look at:
Figure 6 puts DFJ at a similar level as EWJ in terms of weight in unprofitable companies. Both DXJ and the S&P 500 Index have an even lower exposure to unprofitable companies—but not by massive amounts.
The standout number in figure 6 is that the Russell 2000 Index—which we show because we know that investors are far more familiar with U.S. small caps than Japan small caps—had a 23.34% exposure to unprofitable stocks.
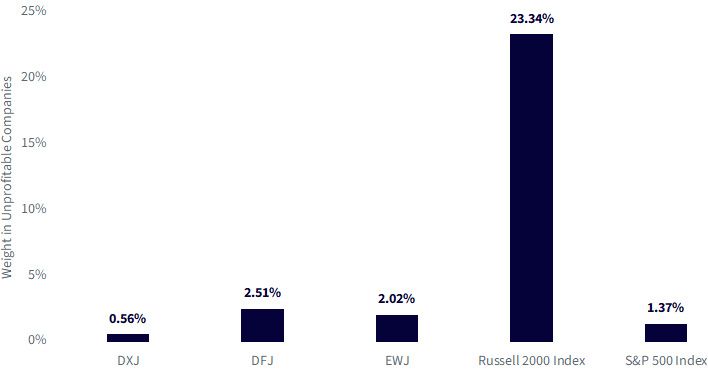
Source: WisdomTree, FactSet, with data accessed in WisdomTree’s PATH Fund Comparison tool as of 6/30/24. You cannot directly
invest in an index.
Figure 7 allows us to look at median earnings growth within these same strategies. Again, the Russell 2000 Index stands out with a negative figure over one year, a figure above 28% over three years, and then a figure above 13.5% over five years. For each time period, it was either the highest or the lowest.
DFJ was more in the middle, with figures looking very similar to that of EWJ. On a three-year basis, it’s also interesting that the S&P 500 Index had a lower median earnings growth than DXJ, DFJ and EWJ. When looking at medians and not weighted averages, the size of the so-called Magnificent 74 is accounted for such that it does not skew the figures.
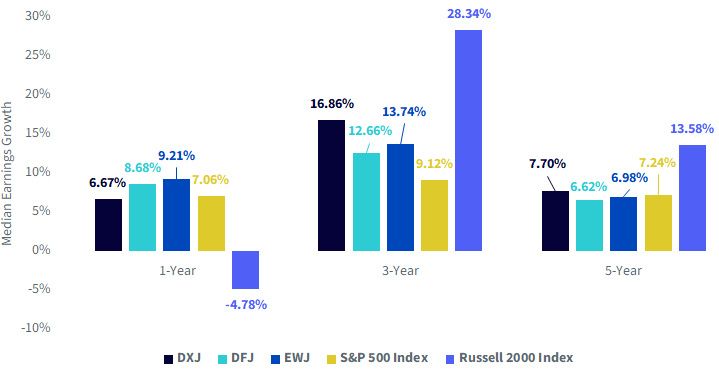
Source: WisdomTree, FactSet, with data accessed in WisdomTree’s PATH Fund Comparison tool as of 6/30/24. You cannot directly invest
in an index.
We understand that many people may read these words and be thinking, wow, Japan small caps, a bit of an “esoteric allocation.” We have attempted to indicate, through such figures as earnings behavior and volatility, that this may not be the case. We also note that if people are thinking about possible “yen strength,” the local business exposure of Japan’s small caps may be attractive.
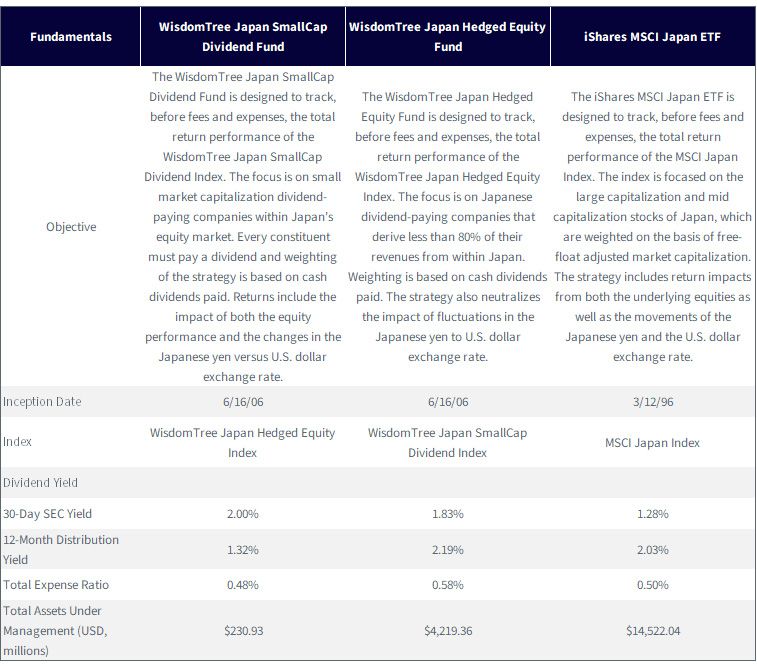
Sources: WisdomTree, iShares. Data was accessed on 8/7/24. Data availability for the 30-Day SEC Yield was such that this figure was reported as of the most recent quarter-end, 6/30/24. The iShares MSCI Japan ETF is focused on large- and mid-capitalization companies of Japan, while the WisdomTree Japan SmallCap Dividend Fund focuses on small cap companies that pay dividends and the WisdomTree Japan Hedged Equity Fund focuses on dividend paying companies while applied a hedge to neutralize fluctuations in the Japanese yen to U.S. dollar exchange rate. Past performance is not indicative of future results. Investment return and principal value of an investment will fluctuate so that an investor’s shares, when redeemed, may be worth more or less than their original cost. Current performance may be lower or higher than the performance data quoted. For the most recent month-end and standardized performance and to download the respective Fund prospectuses, click the relevant ticker: DFJ, DXJ, EWJ.
1 Source: FactSet, with data as of 7/31/24.
2 Source: “Follow-up of Market Restructuring.” Japan Exchange Group, 7/12/24, www.jpx.co.jp/english/equities/follow-up/02.html.
3 Source: MSCI, with standard deviation of returns measured in local currency terms between the MSCI Japan Index and the MSCI Japan Small Cap Index. From inception of the MSCI Japan Small Cap Index, 1/1/01, the standard deviation of monthly returns for the MSCI Japan Small Cap Index was lower through 7/31/24 than that of the MSCI Japan Index. Recent annualized 3-year standard deviation of the MSCI Japan Small Cap Index has also been lower.
4 Source: Refers to Microsoft, Amazon, Alphabet, Apple, Meta Platforms, Nvidia and Tesla.
DXJ: There are risks associated with investing, including the possible loss of principal. Foreign investing involves special risks, such as risk of loss from currency fluctuation or political or economic uncertainty. The Fund focuses its investments in Japan, thereby increasing the impact of events and developments in Japan that can adversely affect performance. Investments in currency involve additional special risks, such as credit risk, interest rate fluctuations and derivative investments, which can be volatile and may be less liquid than other securities, and more sensitive to the effect of varied economic conditions. As this Fund can have a high concentration in some issuers, the Fund can be adversely impacted by changes affecting those issuers. Due to the investment strategy of this Fund it may make higher capital gain distributions than other ETFs. Buybacks and dividends are not guaranteed, and a company currently paying dividends may cease paying dividends at any time. Please read the Fund’s prospectus for specific details regarding the Fund’s risk profile.
DFJ: There are risks associated with investing, including the possible loss of principal. Foreign investing involves special risks, such as risk of loss from currency fluctuation or political or economic uncertainty. Funds focusing their investments on smaller companies or certain sectors increase their vulnerability to any single economic or regulatory development. The Fund focuses its investments in Japan, thereby increasing the impact of events and developments in Japan that can adversely affect performance. This may result in greater share price volatility. Please read the Fund’s prospectus for specific details regarding the Fund’s risk profile.
EWJ: Carefully consider the Fund's investment objectives, risk factors, and charges and expenses before investing. This and other information can be found in the Fund's prospectus, and if available, summary prospectus, which may be obtained by calling 1-800-iShares (1-800-474-2737) or by visiting www.iShares.com or www.blackrock.com. Read the prospectus carefully before investing. Investing involves risk, including possible loss of principal. International investing involves risks, including risks related to foreign currency, limited liquidity, less government regulation, and the possibility of substantial volatility due to adverse political, economic, or other developments. These risks often are heightened for investments in emerging/developing markets or in concentrations of single countries. Diversification may not protect against market risk or loss of principal. Shares of ETFs are bought and sold at market price (not NAV) and are not individually redeemed from the fund. Any applicable brokerage commissions will reduce returns.
Japan Hedged Equity Fund

Global Chief Investment Officer
Jeremy Schwartz has served as our Global Chief Investment Officer since November 2021 and leads WisdomTree’s investment strategy team in the construction of WisdomTree’s equity Indexes, quantitative active strategies and multi-asset Model Portfolios. Jeremy joined WisdomTree in May 2005 as a Senior Analyst, adding Deputy Director of Research to his responsibilities in February 2007. He served as Director of Research from October 2008 to October 2018 and as Global Head of Research from November 2018 to November 2021. Before joining WisdomTree, he was a head research assistant for Professor Jeremy Siegel and, in 2022, became his co-author on the sixth edition of the book Stocks for the Long Run. Jeremy is also co-author of the Financial Analysts Journal paper “What Happened to the Original Stocks in the S&P 500?” He received his B.S. in economics from The Wharton School of the University of Pennsylvania and hosts the Wharton Business Radio program Behind the Markets on SiriusXM 132. Jeremy is a member of the CFA Society of Philadelphia.

Global Head of Research
Christopher Gannatti began at WisdomTree as a Research Analyst in December 2010, working directly with Jeremy Schwartz, CFA®, Director of Research. In January of 2014, he was promoted to Associate Director of Research where he was responsible to lead different groups of analysts and strategists within the broader Research team at WisdomTree. In February of 2018, Christopher was promoted to Head of Research, Europe, where he was based out of WisdomTree’s London office and was responsible for the full WisdomTree research effort within the European market, as well as supporting the UCITs platform globally. In November 2021, Christopher was promoted to Global Head of Research, now responsible for numerous communications on investment strategy globally, particularly in the thematic equity space. Christopher came to WisdomTree from Lord Abbett, where he worked for four and a half years as a Regional Consultant. He received his MBA in Quantitative Finance, Accounting, and Economics from NYU’s Stern School of Business in 2010, and he received his bachelor’s degree from Colgate University in Economics in 2006. Christopher is a holder of the Chartered Financial Analyst Designation.

