
Big Tech's Market Reset: Why This Pullback is Different
Published March 21, 2025

Global Head of Research

Global Chief Investment Officer
Key Takeaways
- Unlike the dot-com bubble, we believe today’s tech giants, including Nvidia, have more reasonable valuations and sustainable earnings growth, making them fundamentally stronger investments.
- Despite recent pullbacks, history shows that periods of market fear often present opportunities, as seen with Amazon, Apple and Nvidia in past downturns.
- The WisdomTree U.S. Quality Growth Fund (QGRW) remains focused on high-growth, high-quality companies, and its recent decline may signal a strategic buying opportunity rather than a reason to exit.
Déjà Vu? The Browser Wars and the AI Model Wars
On March 15, 2025, we saw the following written by @PauloMacro on the X platform:
When I was finishing college, internet browsers and search engines were all the rage.
“I like Netscape better because it loads faster and is easier for XYZ.”
“Opera [a web browser] is easier to use for ABC.”
“IE [Internet Explorer] is glitchy.”
“Amaya [a web browser and internet editor] is getting worse for XYZ”
And then the search engine wars…remember Lycos? Altavista? AskJeeves?? “Yahoo is better for X, I like Altavista for Y though”…
I have boned up some on AIAIAI and spoken with several to learn and explore interesting use cases (including with people here which has been super helpful). And I hear the same thing from people using this stuff regularly.
With all my learning I will just summarize as follows:
LLM [Large Language Model] based chat bots—Claude, ChatGPT, Gemini, Perplexity, Copilot—are to 2025 what web browsers and search engines were to 2000. Same arc. Same contour. Same future of capital destruction realization.
And NVDA [Nvidia] 2025 is *exactly* what Cisco/switch/fiber backbone was in 2000.
Kind of amazing we are doing this all over again because many of these bros were around for the last one. Instead, you have Bill Gates saying it’s different this time. Surreal actually.
It’s a powerful narrative. At WisdomTree, we have the pleasure of working with Professor Jeremy Siegel, our Senior Economist. On March 14, 2000, he published an op-ed in the Wall Street Journal, titled “Big Cap Tech Stocks Are a Sucker Bet.” More powerful than even the text was a table of data, which we reproduce as figure 1. In it we can see:
- These were nine companies with P/E ratios above 100.0x that also had market capitalizations above $85 billion. JDS Uniphase and Yahoo! had P/E ratios above 600.0x.
- The earnings growth estimates were also on fire. This data places us, without lookahead bias, back in March 2000. Yahoo!’s expected EPS growth (earnings per share, not revenues) was nearly 56% per year.
- To understand the feasibility of current valuations, Professor Siegel assumed that 1) the EPS growth estimates were realized over an initial 5 and then 10 years subsequent to this period (through 2005 and then 2010) and 2) the shares returned 15% per year. Five out of the nine companies, even with this incredible growth realized, would still have P/E ratios above 50.0x under these assumptions.
Figure 1: A Clear Look at the 2000 Tech Bubble
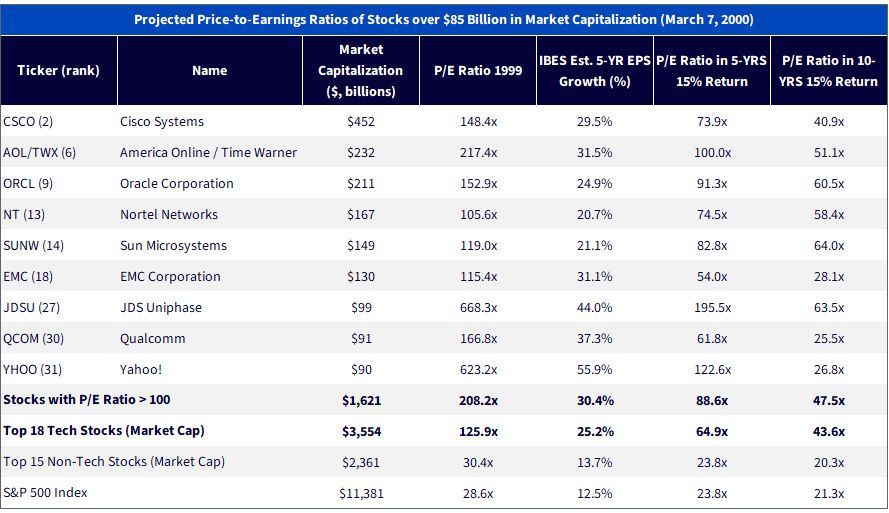
Source: Bloomberg. IBES Est. 5-YR EPS Growth represents the forward-looking estimated earnings-per-share growth over the 5-year period starting in 2000. P/E Ratio in 5-YRS 15% return is shown for illustrative purposes, as is the P/E ratio in 10-YRS 15% Return. The earnings per share is assumed to grow in line with the IBES estimates. The share price is assumed to grow at an average of 15% per year. Past performance is not indicative of future results. You cannot invest directly within an index.
The stories we remember about markets and businesses are important, but it’s our responsibility to marry them with data.
Comparing Cisco Systems in 2000 to Nvidia in 2025 must account for both the story of the business as well as the key valuation and growth fundamentals.
In figure 2, we compare the Magnificent 7 to Siegel’s Big Cap Tech Suckers from 2000:
- Nvidia, with a market capitalization of more than $2.8 trillion, had a P/E ratio of 25.8x, estimated earnings growth for the current year of 50.2%, and trailing five-year earnings growth of nearly 92%—annualized. Cisco was the second largest market cap stock in the S&P 500 Index when Professor Siegel wrote his op-ed in March 2000, and its P/E was 148.4x—roughly between five and six times higher than that of Nvidia. Cisco’s IBES five-year earnings growth estimates were 29.5%, whereas Nvidia’s—coming off a run greater than 90% annualized—are below 20%. Investors and analysts appear a lot more reasonable in their valuation and expectations for Nvidia than they were for Cisco.
- In 1999, the S&P 500 P/E ratio was above 28.0x, but in 2025 we see it at 21.1x.
- The average P/E of the Magnificent 7, including Tesla at 89.7x—is still not quite equal to the level of the S&P 500’s P/E ratio in aggregate in 2000.
- Alphabet is trading below the P/E ratio of the S&P 500 Index now.
- Alphabet is trading below the P/E ratio of the S&P 500 Index now.
Figure 2: Big Tech in 2025 Doesn’t Look Like a Sucker Bet
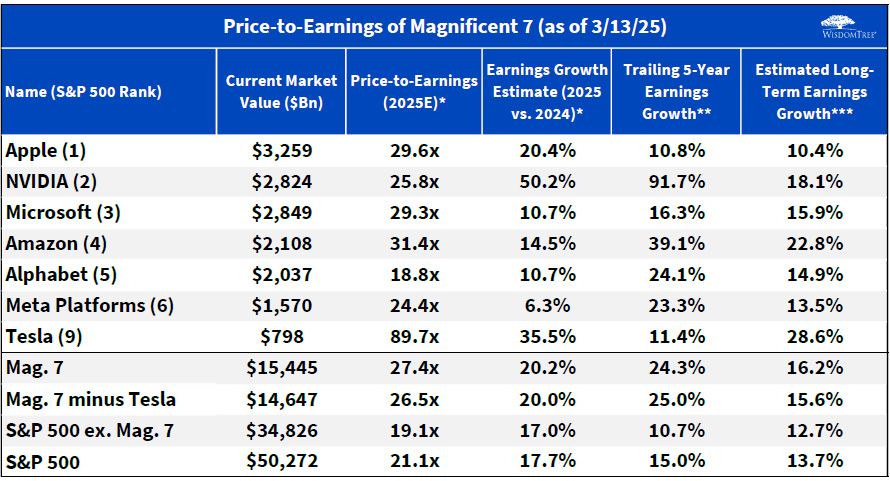
Sources: WisdomTree, FactSet, S&P. *Calendar year price-to-earnings growth based on median analyst estimates. **Trailing 3-Year where 5-year is not available. Growth is annualized. ***Estimated Long-Term Growth is annualized and based on median analyst earnings growth estimates over the next 3 years. Trailing 5-year earnings growth and Estimated Long-Term Earnings Growth are as of 2/28/25. All other data as of 3/12/25. Aggregate Metrics are shown as weighted averages. You cannot invest directly in an index.
Valuation risk is a concern for many. Figure 3 looks back over roughly 30 years, certainly including both the run up to what we now know as the tech bubble of 1999/2000 as well as the subsequent market correction:
- The S&P 500 Index forward P/E ratio eclipsed 30.0x during the tech bubble. In 2025, we have seen this same measure go above 21.5x, but it has been nowhere close to 30.0x. There can still be risk and corrections and volatility, but this data is not indicating valuations are anywhere close to the dot-com era’s levels.
Figure 3: S&P 500 Index Far from Cheap, but Also Far from the Tech Bubble
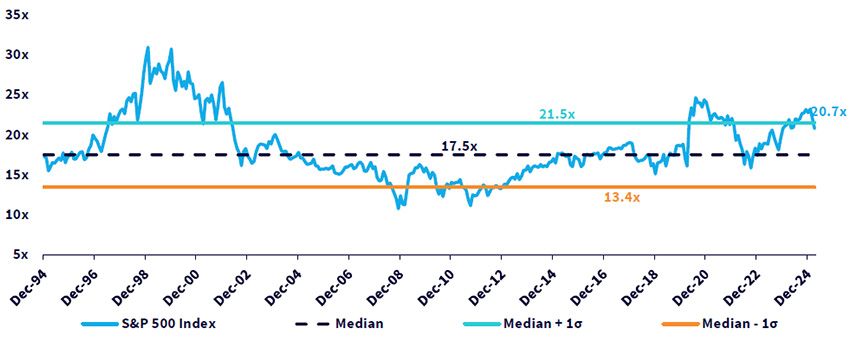
Sources: WisdomTree, FactSet, S&P, as of 3/15/25. You cannot invest directly in an index. Historical forward P/E measured since 12/31/1994.
The Best Investments Can Often Be the Most Uncomfortable
Now, stories and narratives are also important. We have seen it widely reported that the S&P 500 Index has declined more than 10% relative to its recent high, which is correction territory. In figure 4, we can see how this compares to each of the Magnificent 7 stocks, most of which are roughly 20% below their 52-week highs. Tesla is the key exception, at 50% below its 52-week high.
Figure 4: Quantifying the Recent Share Price Corrections
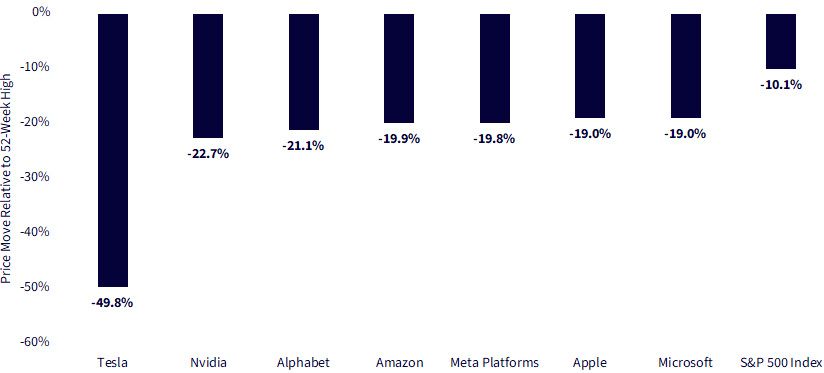
Source: Andrew Bary, “The Mag 7 Stocks Have Gotten Crushed. Buy These 4 Now,” Barron’s, 3/14/25, accessed via Bloomberg. Past performance is not indicative of future results.
History shows a repeating pattern:
- Amazon lost more than 90% of its value in the dot-com crash. People said e-commerce was a fad.1
- In early 2008, Apple’s share price was around $180, dropping to a 2008-low of around $78 in late November. Steve Jobs had only introduced the iPhone in 2007, and it was expensive. At that time, BlackBerry was dominant.2
- Nvidia saw its share price trading around $300 at the beginning of 2022, but it dropped to around $110 by October of that year.3 “AI chips are cyclical,” they said.
It’s impossible to overstate the difficulty of being a buyer of stocks when most other people are selling, contributing to drawdowns like this. However, it may be helpful to recognize that for those who had patience, narratives led to successful business results and a compounding of returns over time. These are some of the best businesses that have ever existed if one is judging on things like revenues, profits or growth, so for most, being exposed to diversified strategies may feel better than placing undue risk on a few companies.
Conclusion: QGRW Just Got more Interesting
The WisdomTree U.S. Quality Growth Fund (QGRW) is designed to track the total return performance, before fees and expenses, of the WisdomTree U.S. Quality Growth Index. The strategy focuses exposure on large U.S. businesses that are exhibiting both fast earnings growth and strong quality metrics, like return on equity and return on assets. Companies like Nvidia, Apple and Amazon.com have historically had healthy weights in the top 10, due to both their strong fundamentals and their large market cap sizes. However, these are just three of 100 such stocks.
In our opinion, investors should love a good deal—just like consumers hunting for discounts. When stocks pull back, it should feel like a sale. But in markets, lower prices often trigger fear instead of excitement. This fear can be compounded by another common pitfall: the urge to sell at the top and buy back at the bottom. It sounds great in theory, but in practice, it requires two perfect decisions—when to exit and when to re-enter. Many investors get at least one wrong, and often both. The better strategy? We believe time in the market beats timing the market. Right now, QGRW is down, but it still holds the same high-quality, high-growth companies that made it compelling in the first place. For those who are thinking on a longer time horizon, this isn’t a reason to panic—it’s a moment to rethink your investing strategy.
Figure 5: Standardized Returns
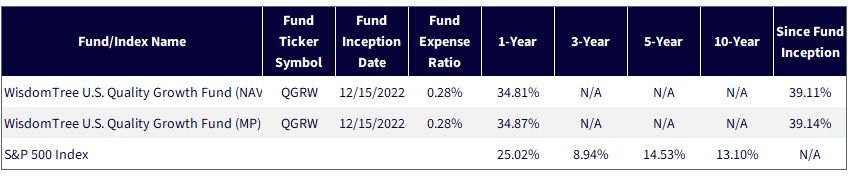
Source: WisdomTree, specifically data from the Fund Comparison Tool in the PATH suite of tools, accessed 3/16/25 with returns as of 12/31/24. NAV denotes total return performance at net asset value. MP denotes market price performance. Past performance is not indicative of future results. Investment return and principal value of an investment will fluctuate so that an investor’s shares, when redeemed, may be worth more or less than their original cost. Current performance may be lower or higher than the performance data quoted. For the most recent month-end and standardized performance, click here.
Figure 6: QGRW’s Performance since its Inception in 2022
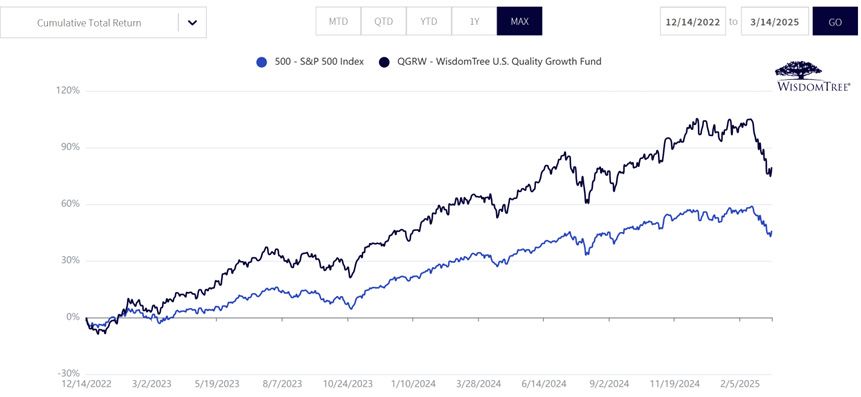
Source: WisdomTree, specifically data from the Fund Comparison Tool in the PATH suite of tools, accessed 3/16/25 with returns as of 3/14/25. NAV denotes total return performance at net asset value. Past performance is not indicative of future results. Investment return and principal value of an investment will fluctuate so that an investor’s shares, when redeemed, may be worth more or less than their original cost. Current performance may be lower or higher than the performance data quoted. For the most recent month-end and standardized performance, click here.
1 Source: Andrew Dravis, “At One Point, Amazon Lost More than 90% of its Value. But Long-Term Investors Still Got Rich,” CNBC, 12/18/18.
2 Source: Macrotrends.
3 Source: Yahoo! Finance, Investing.com and Macrotrends.
Important Risks Related to this Article
There are risks associated with investing, including the possible loss of principal. Growth stocks, as a group, may be out of favor with the market and underperform value stocks or the overall equity market. Growth stocks are generally more sensitive to market movements than other types of stocks. The Fund is non-diversified, as a result, changes in the market value of a single security could cause greater fluctuations in the value of Fund shares than would occur in a diversified fund. The Fund invests in the securities included in, or representative of, its Index regardless of their investment merit. The Fund does not attempt to outperform its Index or take defensive positions in declining markets and the Index may not perform as intended. Please read the Fund’s prospectus for specific details regarding the Fund’s risk profile.
Categories
About the contributors

Global Head of Research
Christopher Gannatti began at WisdomTree as a Research Analyst in December 2010, working directly with Jeremy Schwartz, CFA®, Director of Research. In January of 2014, he was promoted to Associate Director of Research where he was responsible to lead different groups of analysts and strategists within the broader Research team at WisdomTree. In February of 2018, Christopher was promoted to Head of Research, Europe, where he was based out of WisdomTree’s London office and was responsible for the full WisdomTree research effort within the European market, as well as supporting the UCITs platform globally. In November 2021, Christopher was promoted to Global Head of Research, now responsible for numerous communications on investment strategy globally, particularly in the thematic equity space. Christopher came to WisdomTree from Lord Abbett, where he worked for four and a half years as a Regional Consultant. He received his MBA in Quantitative Finance, Accounting, and Economics from NYU’s Stern School of Business in 2010, and he received his bachelor’s degree from Colgate University in Economics in 2006. Christopher is a holder of the Chartered Financial Analyst Designation.

Global Chief Investment Officer
Jeremy Schwartz has served as our Global Chief Investment Officer since November 2021 and leads WisdomTree’s investment strategy team in the construction of WisdomTree’s equity Indexes, quantitative active strategies and multi-asset Model Portfolios. Jeremy joined WisdomTree in May 2005 as a Senior Analyst, adding Deputy Director of Research to his responsibilities in February 2007. He served as Director of Research from October 2008 to October 2018 and as Global Head of Research from November 2018 to November 2021. Before joining WisdomTree, he was a head research assistant for Professor Jeremy Siegel and, in 2022, became his co-author on the sixth edition of the book Stocks for the Long Run. Jeremy is also co-author of the Financial Analysts Journal paper “What Happened to the Original Stocks in the S&P 500?” He received his B.S. in economics from The Wharton School of the University of Pennsylvania and hosts the Wharton Business Radio program Behind the Markets on SiriusXM 132. Jeremy is a member of the CFA Society of Philadelphia.