
HEDJ
Europe Hedged Equity Fund

Published March 20, 2025

Research Analyst
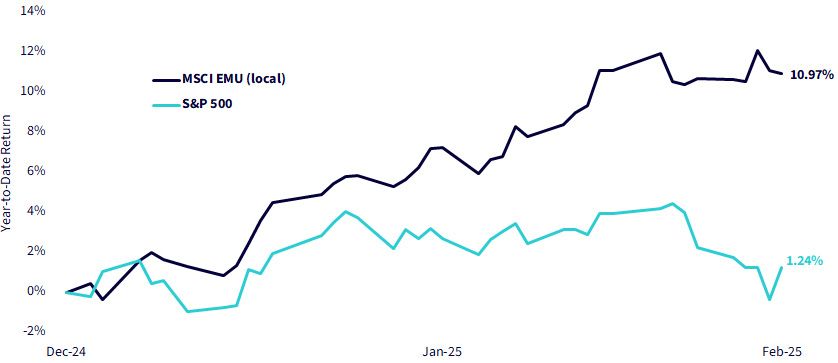
European equities are off to a strong start in 2025. The MSCI EMU (Europe) Index is up 11% year-to-date in local returns, while the S&P 500 is up just 1.4%. You're reading that right: Europe has so far delivered almost 8x the returns of the United States this year.
As shown in figure 1 below, Europe's outperformance is clear when comparing returns to the U.S. market.
Sources: WisdomTree, FactSet. Data from 12/31/24–2/28/25. You cannot invest directly in an index. Past performance is not indicative of future returns.
As inflation is forecast to hover close to 2%—the target rate of the European Central Bank (ECB)—the ECB cut rates by 25 basis points in January and is expected to continue doing so until the middle of the year.
Depending on how the myriad geopolitical and regulatory issues surrounding the continent play out, the European market could realize a Goldilocks situation where equities are supported by lower rates and controlled inflation.
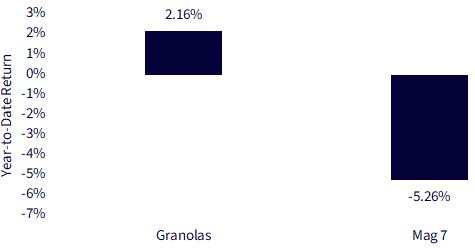
Last year, we discussed the GRANOLAS basket of 11 European stocks that appeared to hold its own against the Magnificent 7. After months of subsequent underperformance, the GRANOLAS are currently up 2.16% year-to-date, while the Magnificent 7 is down more than 5%. This contrast in returns is illustrated in the following comparison in figure 2.
Sources: WisdomTree, FactSet. Data from 12/31/24–2/28/25. You cannot invest directly in an index. Past performance is not indicative of future returns.
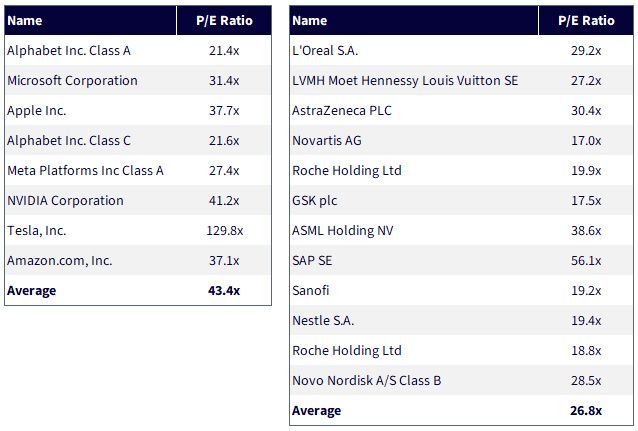
What's more impressive is that these companies have managed to deliver outsized returns at much smaller valuation metrics. The price-to-earnings (P/E) ratios of the two groups highlight this valuation gap, as seen in figure 3.
Source: WisdomTree, FactSet, as of 2/28/25. Past performance is not indicative of future returns.
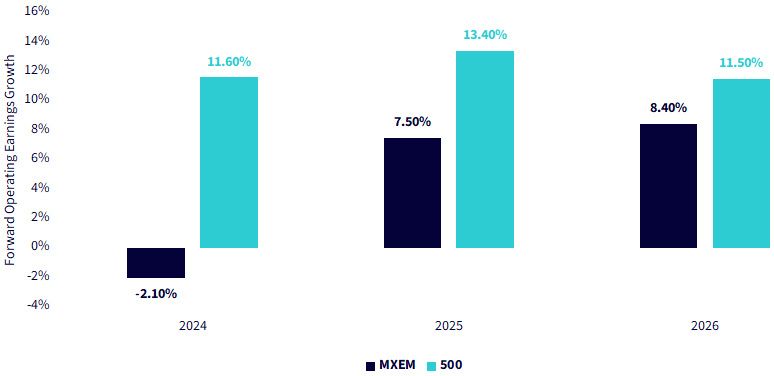
European forward earnings growth is closing the gap with that of U.S. equities. At the time of writing, the difference between the MSCI EMU Index's and S&P 500's 2025 forward earnings growth is 5.9%. The difference for 2026 is almost halved at 3.1%. This narrowing gap in forward earnings growth is illustrated in figure 4.
Sources: WisdomTree, FactSet, as of 3/10/25. Fundamental metrics show calendar-year growth rates for each respective metric (earnings, sales) compared to the prior year.
The euro made headlines when it fell to parity with the U.S. dollar in 2022. In 2025, the EUR/USD rate almost hit parity again at the beginning of the year. The historical trend of the EUR/USD exchange rate captures these fluctuations, as displayed in figure 5.
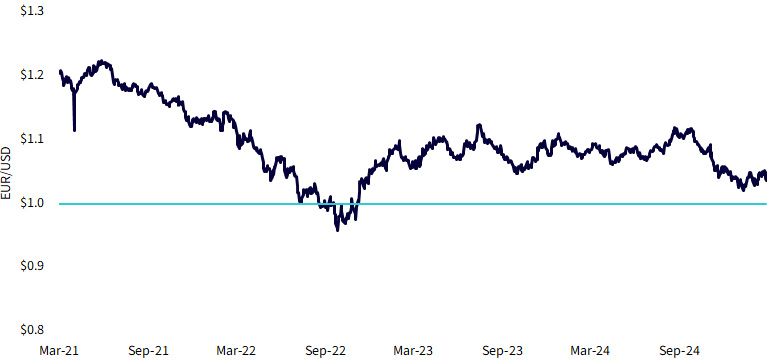
Source: WisdomTree. Data from 2/28/21–2/28/25.
It's difficult to say which direction the currency pair will move next, but investors who are seeking exposure to European equities without the effects of foreign exchange fluctuations may want to consider European hedged equity products such as the WisdomTree Europe Hedged Equity Fund (HEDJ) and the WisdomTree Europe Hedged SmallCap Equity Fund (EUSC).
HEDJ tracks the WisdomTree Europe Hedged Equity Index, which allocates to dividend-paying eurozone equities with an exporter tilt. The Index neutralizes movements in the EUR/USD exchange rate through currency hedging. The performance comparison of HEDJ to the iShares Currency Hedged MSCI Eurozone ETF (HEZU) in figure 6 highlights how currency-hedged strategies have fared in this environment.
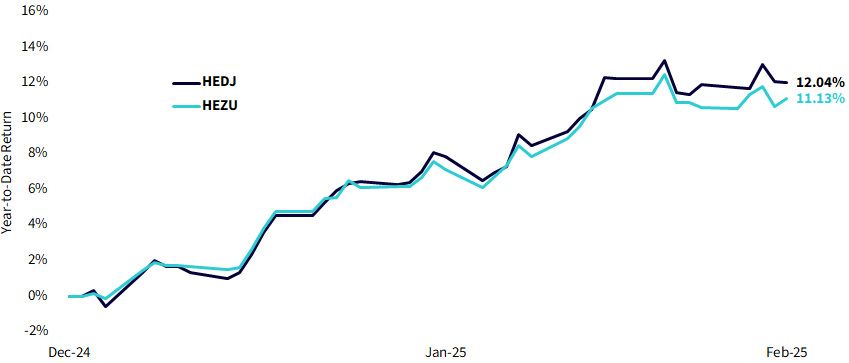
Sources: WisdomTree, FactSet. Data from 12/31/24–2/28/25. All funds are managed differently and do not react the same to economic or market events. The investment objectives, strategies, policies or restrictions of other funds may differ and more information can be found in their respective prospectuses. Therefore, we generally do not believe it is possible to make direct fund to fund comparisons in an effort to highlight the benefits of a fund versus another similarly managed fund. Please see Figure 11 for material differences between the funds. The performance data quoted represents past performance. Past performance is not indicative of future returns. Investment return and principal value of an investment will fluctuate so that an investor's shares, when redeemed, may be worth more or less than their original cost. Current performance may be lower or higher than the performance data quoted. For the standardized performances, please click the respective ticker: HEDJ, HEZU.
The WisdomTree Europe Hedged Equity Index only selects companies that derive at least 50% of their revenues from countries outside of Europe. This exporter tilt was a key driver of year-to-date outperformance relative to the MSCI EMU Index. The Index attribution breakdown in figure 7 below shows what has driven this performance.
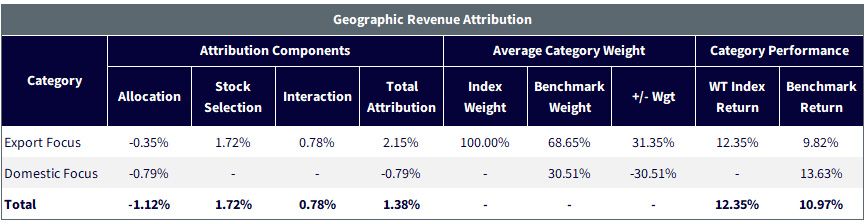
Sources: WisdomTree, FactSet. Data from 12/31/24–2/28/25. You cannot invest directly in an index. Past performance is not indicative of future returns.
The revenue exposure of these companies further illustrates how much of their business comes from outside Europe, as shown in figure 8.
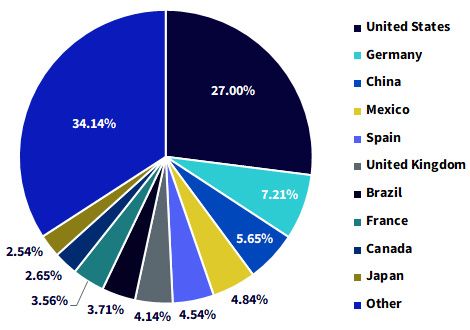
Sources: WisdomTree, FactSet, as of 2/28/25. You cannot invest directly in an index.
With governments enacting policy measures, central banks adjusting interest rates and geopolitical events shaking markets, it's easy to get lost in the noise. But one thing is certain: Success is rented, not owned. And right now, European equities are snapping at the heels of American stocks to draw investors across the pond.
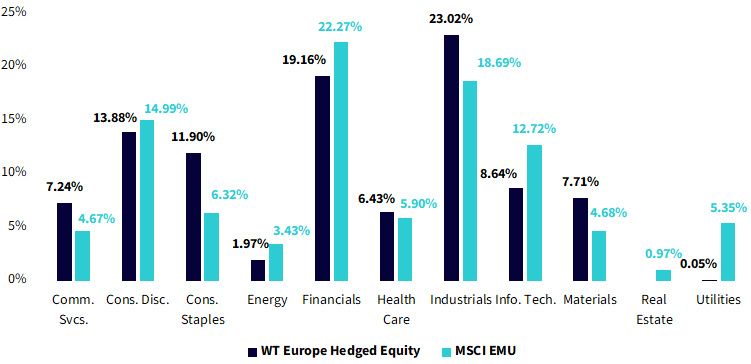
Sources: WisdomTree, FactSet, as of 2/28/25. You cannot invest directly in an index.

Sources: WisdomTree, FactSet, as of 2/28/25. You cannot invest directly in an index. Past performance is not indicative of future returns. Investment return and principal value of an investment will fluctuate so that an investor's shares, when redeemed, may be worth more or less than their original cost. Current performance may be lower or higher than the performance data quoted. For the standardized performance, please click here. For definitions of terms in the table above, please visit the glossary.
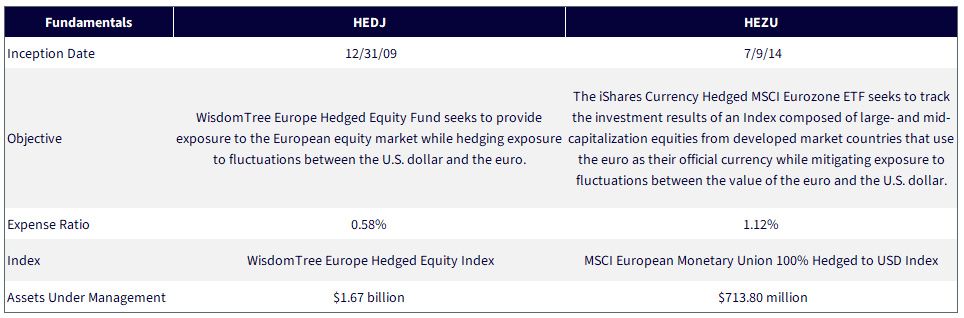
Sources: WisdomTree, iShares, as of 3/13/25. For definitions of terms in the table above, please visit the glossary.
HEDJ: There are risks associated with investing, including the possible loss of principal. Foreign investing involves special risks, such as risk of loss from currency fluctuation or political or economic uncertainty. Investments in currency involve additional special risks, such as credit risk and interest rate fluctuations. Derivative investments can be volatile, and these investments may be less liquid than other securities and more sensitive to the effect of varied economic conditions. As this Fund can have a high concentration in some issuers, the Fund can be adversely impacted by changes affecting those issuers. Due to the investment strategy of this Fund, it may make higher capital gain distributions than other ETFs. Dividends are not guaranteed, and a company currently paying dividends may cease paying dividends at any time. Please read the Fund’s prospectus for specific details regarding the Fund’s risk profile.
HEZU: Carefully consider the Fund’s investment objectives, risk factors, charges and expenses before investing. This and other information can be found in the Fund’s prospectus and, if available, summary prospectus, which may be obtained by calling 1-800-iShares (1-800-474-2737) or by visiting www.iShares.com or www.blackrock.com. Read the prospectus carefully before investing.
Investing involves risk, including the possible loss of principal.
International investing involves risks, including risks related to foreign currency, limited liquidity, less government regulation and the possibility of substantial volatility due to adverse political, economic or other developments. These risks are often heightened for investments in emerging/developing markets or in concentrations of single countries.
The Fund’s use of derivatives may reduce the Fund’s returns and/or increase volatility and subject the Fund to counterparty risk, which is the risk that the other party in the transaction will not fulfill its contractual obligation. The Fund could suffer losses related to its derivative positions because of a possible lack of liquidity in the secondary market and as a result of unanticipated market movements; such losses are potentially unlimited. There can be no assurance that the Fund’s hedging transactions will be effective.
Investment in the Fund is subject to the risk of the underlying Funds.
Diversification may not protect against market risk or loss of principal. Shares of ETFs are bought and sold at market price (not NAV) and are not individually redeemed from the Fund. Any applicable brokerage commissions will reduce returns.

Research Analyst
Hyun Kang joined WisdomTree in July 2022 as a Research Analyst. As a part of the Index team, he assists with the creation and maintenance of the firm’s indexes and supports the group’s research initiatives across various strategies. Hyun graduated from Carnegie Mellon University, with a B.S. in Business Administration and an additional major in Statistics and Machine Learning.
