
Global Dividend Stream: Where we saw growth in 2018
Published 28 November 2018

Contributor
Each year, we monitor the global Dividend Stream1 for growth, so that we can refresh the weights of the underlying constituent companies in various WisdomTree Indices.
This year, the global Dividend Stream reached another new high, and all regional markets (United States, developed world and Emerging Markets) reached new highs as well. The global Dividend Stream is measured in US Dollars, so the Dollar’s strength over the past year slightly lowered growth rates when compared to local growth. The global Dividend Stream was able to grow at 8.59% over the most recent one-year period in US Dollar terms and approximately 11.06% in local currency terms2.
To calculate the global Dividend Stream, we start with the 5,900-plus investable dividend payers in the WisdomTree Global Dividend Index. We then take the dividends per share for each company and multiply them by the company’s shares outstanding. The table below aggregates the Dividend Streams of each company by their respective region and shows a percentage breakdown by region.
Figure 1: Global Dividend Stream
Source: WisdomTree, as of 30 September 2018. You cannot invest directly in an index.
Historical performance is not an indication of future performance and any investments may go down in value.
Focus on Emerging Markets
One of the major regions that is rebalanced at this time of year is the emerging markets, and many clients want to know how dividends have grown across the various emerging market countries. The table below highlights the growth by country, which can be influenced by new payers, or by existing payers increasing their Dollar dividend payments.
Figure 2: Emerging Market (EM) dividend growth by country 2017-2018
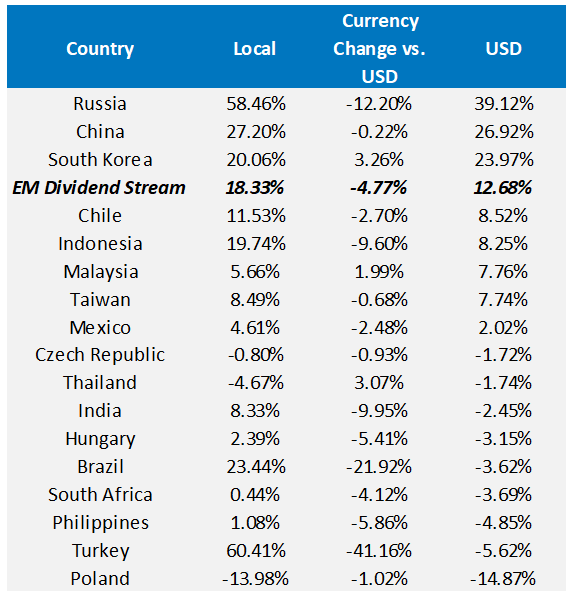
Source: WisdomTree, 30 September 2017 – 30 September 2018.
Historical performance is not an indication of future performance and any investments may go down in value.
- Russia: Known for its large landmass and plethora of natural resources, Russia’s energy and materials companies delivered strong dividend growth on the back of improving earnings. Energy company Rosneft more than doubled its dividend per share year over year, an increase of over $2 billion3. Even though energy giant Gazprom kept its dividend constant and Lukoil only raised its dividend modestly, other companies like Tatneft and MMC Norilsk Nickel contributed to the country’s dividend growth. Sberbank, a large financial company, also contributed substantially to the country’s growth with a 100% increase in its annual dividend.
- China: Large increases from energy companies also benefited China, with China Petroleum & Chemical Corp and China National Offshore Oil Corporation (CNOOC) adding around $1 billion each to the stream4. One of China’s largest dividend payers, China Mobile, also contributed an over $1-billion increase to the Dividend Stream5. We note with interest that, in aggregate, the A-share market’s Dividend Stream is even larger.
- South Korea: As the largest company by market cap in South Korea, and its largest dividend payer, Samsung has significant influence on the growth of the country’s Dividend Stream. In October 2017, Samsung announced it was committed to paying out over 9.6 trillion Korean Won in dividends (approximately $8.5 billion) for each of fiscal years 2018 to 20206. So far this year, the company seems to be on pace, which has increased its year-over-year amount.
Understanding the source of dividend growth, while important, is just one part of a rules-based, relative-value process. To determine where the value really shines, we must consider this fundamental growth in relation to changes in price. In upcoming blog posts we will look at the various indices using this dividend information in their weightings and discuss any changes for this year’s newly reconstituted indices.
1 The Dividend Stream is a term devised by WisdomTree, and it refers to the dividend per share of a firm over the prior annual cycle, measured as of 30 September each year, multiplied by the number of shares outstanding. Figures are converted into US Dollar terms.
2 WisdomTree, as of 30 September 2018
3 Standard & Poor’s, Factset, Bloomberg, with data measured over the annual dividend cycle ended 30 September 2018.
4 Standard & Poor’s, Factset, Bloomberg, with data measured over the annual dividend cycle ended 30 September 2018.
5 Standard & Poor’s, Factset, Bloomberg, with data measured over the annual dividend cycle ended 30 September 2018.
6 Standard & Poor’s, Factset, Bloomberg, with data measured over the annual dividend cycle ended 30 September 2018.
Related blogs
+ Dividends could guide a global equity allocation
+ Separating good from bad emerging market exposure
Related products
+ WisdomTree Emerging Markets SmallCap Dividend UCITS ETF
Categories
About the contributor
