

European small-caps: What fundamentals are telling us
Published 27 March 2018

Global Head of Research
European small-caps have delivered very strong performance over the past few years. One reason for this is that they offer a high degree of exposure to the more cyclical parts of the European equity markets, and these areas have benefited as economic growth expectations and sentiment have been improving.
Market multiples falling on strong earnings gains
A typical concern for investors is buying yesterday’s trade after share prices have run up and valuations have been stretched. In decomposing the P/E ratio, the metric is agnostic to the currency impact as the numerator and denominator are denominated in the same currency. What has led to multiple contraction for European small caps has been improving earnings, as well as improving earnings growth expectations.
In comparing the multiple contraction in European small-caps to US small-caps, as shown by the Russell 2000 Index, it is apparent that US valuations have hardly changed since the beginning of 2017 despite lacklustre returns. From a valuation perspective, Europe offers an attractive discount when comparing the WisdomTree Europe SmallCap Dividend Index to the Russell 2000 Index. The valuation discount is particularly notable despite the WisdomTree Index’s price increase outpacing that of the Russell Index during this period.
Price and profit growth
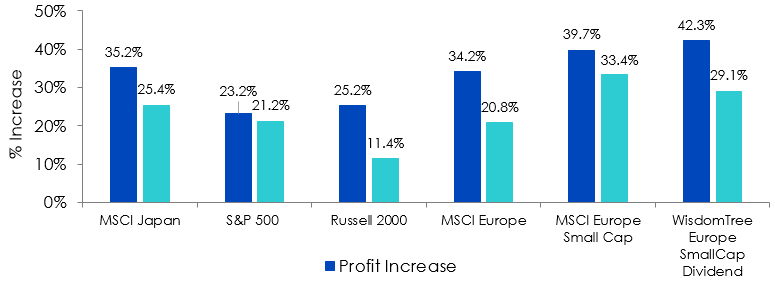
Sources: WisdomTree, FactSet, Bloomberg, as of 30/12/2016 to 28/2/18. Profit and price increase calculated in USD. P/E measured by forward price-to-earnings. You cannot invest directly in an index. Index performance does not represent actual fund or portfolio performance. A fund or portfolio may differ significantly from the securities included in the index. Index performance assumes reinvestment of dividends but does not reflect any management fees, transaction costs or other expenses that would be incurred by a portfolio or fund, or brokerage commissions on transactions in fund shares. Such fees, expenses and commissions could reduce returns.
Past performance is not indicative of future results.
Small-caps tapping into cyclical growth
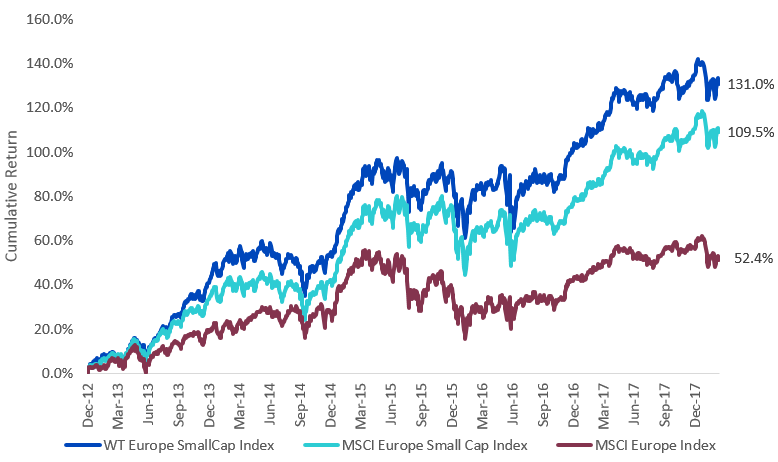
Sources: WisdomTree, Bloomberg. Index returns in net total return EUR. You cannot invest directly in an index.
Past performance is not indicative of future results.
A slow eurozone recovery, beginning in large part in early 2013 with a commitment to extreme monetary policy by the European Central Bank (ECB), has resulted in small-caps outperforming large significantly since December 31, 2012, as measured by the MSCI Europe and MSCI Europe Small Cap Indexes. As gross domestic product (GDP) steadily increased over the past several quarters1, the European Commission’s Economic Sentiment Indicator reached a 10-year high2 and the United Kingdom was able to broadly weather the economic impacts of the Brexit vote, the outperformance of small-caps accelerated in 2017 with a return advantage of more than 800 basis point (bps)3. When reviewing the picture of sector and size earnings growth since 2012, we see that small-cap earnings-per-share (EPS) growth outpaced nearly every sector that we define as cyclical during this secular recovery.
The WisdomTree Europe SmallCap Dividend Index takes this cyclical growth responsiveness a step further with a methodology that imposes a quality bias and results in an interesting sector tilt toward cyclicals. The WisdomTree Index requires that companies pay dividends on an annual basis to maintain eligibility for inclusion, and those selected dividend payers are then weighted by their regular cash dividends. As a result, the Index tilts largely toward profitable companies that have enough earnings to support their level of cash dividends. From a sector perspective, the methodology yields a greater than 80% index weight in what we define as cyclical sectors4, compared to a less than 70% weight for the MSCI Europe Index5.
Earnings growth (31/12/12–28/02/18)
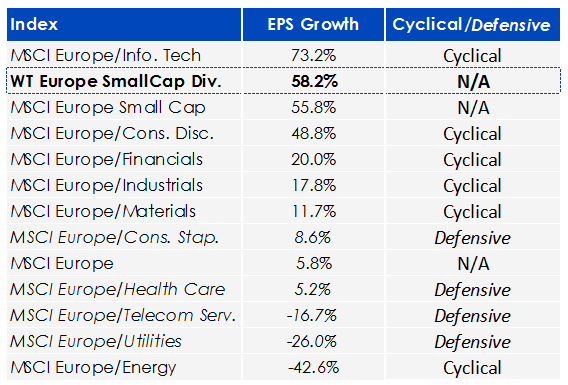
Sources: WisdomTree, FactSet. EPS growth in USD. Index returns in net total return USD. You cannot invest directly in an index.
Past performance is not indicative of future results.
1 Source: “Eurozone GDP growth accelerates to 0.6% in Q2,” Financial Times, 8/1/17.
2 Source: Trading Economics.
3 Source: Bloomberg, 12/30/16–9/29/17.
4 Cyclical sectors: All sectors excluding Health Care, Telecommunication Services, Utilities and Consumer Staples.
5 Sources: WisdomTree, FactSet, 9/29/17.
You may also be interested in reading…
+ The European small-cap rally: What fundamentals are telling us
Categories
About the contributor

Global Head of Research
Christopher Gannatti began at WisdomTree as a Research Analyst in December 2010, working directly with Jeremy Schwartz, CFA®, Director of Research. In January of 2014, he was promoted to Associate Director of Research where he was responsible to lead different groups of analysts and strategists within the broader Research team at WisdomTree. In February of 2018, Christopher was promoted to Head of Research, Europe, where he was based out of WisdomTree’s London office and was responsible for the full WisdomTree research effort within the European market, as well as supporting the UCITs platform globally. In November 2021, Christopher was promoted to Global Head of Research, now responsible for numerous communications on investment strategy globally, particularly in the thematic equity space. Christopher came to WisdomTree from Lord Abbett, where he worked for four and a half years as a Regional Consultant. He received his MBA in Quantitative Finance, Accounting, and Economics from NYU’s Stern School of Business in 2010, and he received his bachelor’s degree from Colgate University in Economics in 2006. Christopher is a holder of the Chartered Financial Analyst Designation.