

Decoding the dollar cycle vs. the business cycle
Published 26 June 2018

Global Head of Research
It wasn’t that long ago that we were experiencing a spectacular degree of dollar strength during 2014 and 2015—more than 23% appreciation in these two years as measured by the DXY Index1.
We have been focused on helping investors better understand the drivers behind different currency movements and this piece examines both valuation and economic growth indicators2.
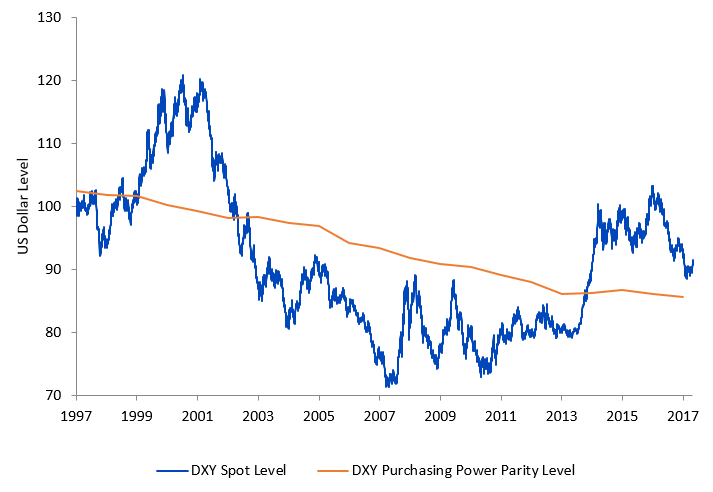
Figure 1: US Dollar Index Spot Level vs. US Dollar Index Purchasing Power Parity Level (31 January 1997 to 31 March 2018)
Sources: Bloomberg, Record. Based on weighting Euro Area 19 (57.6%), Japan (13.6%), United Kingdom (11.9%), Canada (9.1%), Sweden (4.2%), Switzerland (3.6%).
You cannot invest directly in an Index. Historical performance is not an indication of future performance and any investments may go down in value.
Purchasing Power Parity (PPP) might be most popularized by its relation to the “Big Mac” Index. The gist of the Big Mac Index is that a ubiquitous product—the McDonald’s Big Mac—should cost just about the same, adjusting for exchange rates, in different countries. A tradable basket of goods should have the same cost, no matter the currency. The orange line represents an estimate of the appropriate PPP level for the US Dollar, using a basket of global currencies that approximate exposures of the DXY Index.
Currency spot rates, however, do not take PPP in consideration and do not move in alignment as an exact science. Over the last 20 years, the DXY spot rate has been both considerably above and below PPP, punctuated by strong appreciation and strong depreciation.
2014’s upward spike in performance of the US Dollar was extreme, and it took DXY from a discount relative to PPP to a premium relative to PPP. While this premium still persists, it is more modest, and brings into context some of the moves of 2016 and 2017—even in the face of divergent central bank policy.
Connecting currency movements with relative growth cycles
While PPP is important, it is rare to see it take center stage. In today’s world, governments are searching for ways to grow faster. Developed markets have lots of debt and faster growth allows for either the raising of greater revenues OR more inflation which allows for the paying down of debt with currency that is worth less over time.
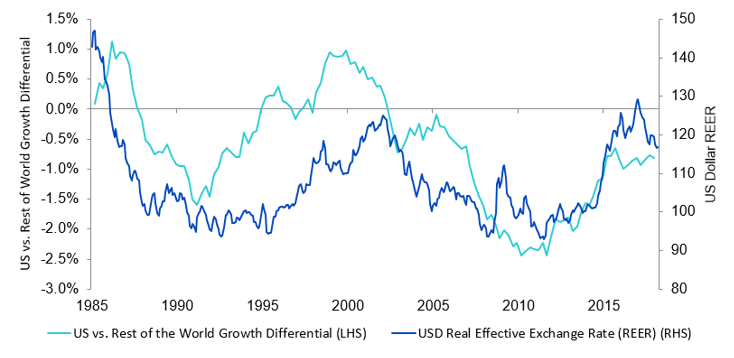
There is a fairly strong relationship between the trajectory of US growth versus the rest of the world along with the US Dollar’s real effective exchange rate against a basket of currencies.
Figure 2: Relative Growth Cycles and FX (31 January 1985 to 30 April 2018)
Sources: Bank of International Settlements (BIS), Macrobond, Record.
You cannot invest directly in an Index. Historical performance is not an indication of future performance and any investments may go down in value.
Neither US growth nor the dollar tend to stay at a constant level versus the rest of the world. As the world’s largest economy, the United States is nowhere near the fastest growing, and it is frequently growing at a slower rate than the rest of the world as shown in the chart, which notably has a 40-50% exposure to much faster growing emerging market countries.
Notably, during periods of appreciation in the real effective exchange rate, the US tends to increase its growth relatively to the rest of the world. At the end of 2015, US growth relative to the rest of the world peaked and stopped what had been a trend of US growth acceleration relative to other countries. The real effective exchange rate responded in kind.
The connection of Central Bank activity & the growth cycle
Figure 3: Output Gap (% of potential output) from 31 March 1983 to 31 December 2017
Source: Macrobond, Holston-Laubach-Williams, Bank of Japan, Record.
Historical performance is not an indication of future performance and any investments may go down in value.
The Output Gap is a way to think about the effectiveness of a given economy at achieving a level closer to its potential output.
The US tends to accelerate first out of a recessionary period. Connecting to the prior chart and understanding that developed markets today are more interconnected than ever before, it is during this acceleration that the bulk of dollar strength is seen. Then, other economies begin to catch up with the US, thereby seeing their growth accelerate on a relative basis. The US therefore tends to reach the point where its central bank is thinking about inflation first—and experiencing inflation first—before other central banks are taking action.
The UK, Eurozone and Japan started displaying acceleration relative to the US and this explains the dollar’s relative weakness in 2017.
Looking forward - outcomes for UK, Eurozone and Japan are by no means assured
In 2017, the UK, Eurozone and Japan had many positive economic surprises—in some cases, genuinely positive, while in others less decidedly negative. 2018’s outcomes are by no means assured, and recent growth momentum signs may be reversing yet again. While the dollar is not ‘cheap’ on a PPP basis, it also not overly expensive and there are a number of forces that can push it higher.
What is the investment takeaway?
This was the third blog in a series evaluating the driver of currency markets. What should you do with all this information?
In many ways, the complexity of currency markets suggests one should not feel overconfident in their ability to forecast currency movements. This leaves many stuck in their status quo bias with legacy positions. We point out that the status quo of being unhedged relies on a weak dollar bet persisting, forever. Being unhedged implies a directional currency bet – whereas strategically hedging involves mitigating any directional bets.
WisdomTree suggests having a currency hedging program to neutralize the risks that come with currency exposure. Hedging can be done either strategically to lower risk, 50% hedged to minimize regret, or with a dynamic overlay strategy to add alpha. All are reasonable currency programs—what we question the most is being 100% unhedged all the time and the assumption of unrewarded risk.
Related blogs:
+ Unwrapping the Mystery of Dollar Depreciation in 2017
+ US Dollar trifecta: inflation, elections, policy
1 Bloomberg, with data measured from 31 December 2013 to 31 December 2015
2 We’d like to thank Record Currency Management, a global thought leader on currencies for analytical support in this blog series.
Categories
About the contributor

Global Head of Research
Christopher Gannatti began at WisdomTree as a Research Analyst in December 2010, working directly with Jeremy Schwartz, CFA®, Director of Research. In January of 2014, he was promoted to Associate Director of Research where he was responsible to lead different groups of analysts and strategists within the broader Research team at WisdomTree. In February of 2018, Christopher was promoted to Head of Research, Europe, where he was based out of WisdomTree’s London office and was responsible for the full WisdomTree research effort within the European market, as well as supporting the UCITs platform globally. In November 2021, Christopher was promoted to Global Head of Research, now responsible for numerous communications on investment strategy globally, particularly in the thematic equity space. Christopher came to WisdomTree from Lord Abbett, where he worked for four and a half years as a Regional Consultant. He received his MBA in Quantitative Finance, Accounting, and Economics from NYU’s Stern School of Business in 2010, and he received his bachelor’s degree from Colgate University in Economics in 2006. Christopher is a holder of the Chartered Financial Analyst Designation.